GESTOFS-develop
DISCLAIMER: This model is under experimental development. The results should not be used for navigational purposes or emergency planning under any circumstances. Please do not duplicate and use the result figures from this website without permission.
UPDATES
- Established on 07-11-2021: ND development version, 1 day nowcast and 5 day forecast for every day.
- Updated on 08-30-2021: Changed to do 7 day forecast, and forced 13km resolution 3 hourly GFS forecast data.
NOTES
The forecast system runs once a day, the forecast animations are uploaded at 10:40, the water level figures are updated at 10:00, 12:15, 15:05, 18:05 for comparing with the latest observational data from NOAA stations. The time zone shown in the figures is in UTC. However, depending on the computer condition, the posted results might be delay.
1. GESTOFS v4.1.4
GESTOFS v4.1.4 model is the same global model used on https://cera.coastalrisk.live. Global finite element mesh: 8,452,486 nodes, 16,226,163 elements; compuational time step: 12s; computational wallclock time: about 2h30min by using 240 cores for 5 day forecast.
2. GFS-FV3 wind speed (7 day forecast)
3. ADCIRC surface water elevation (7 day forecast)
Animation, 2 hourly output. The simulation result in the animation apply ADCIRC with ice parameterization.
4. GFS-FV3 ice concentration (7 day forecast)
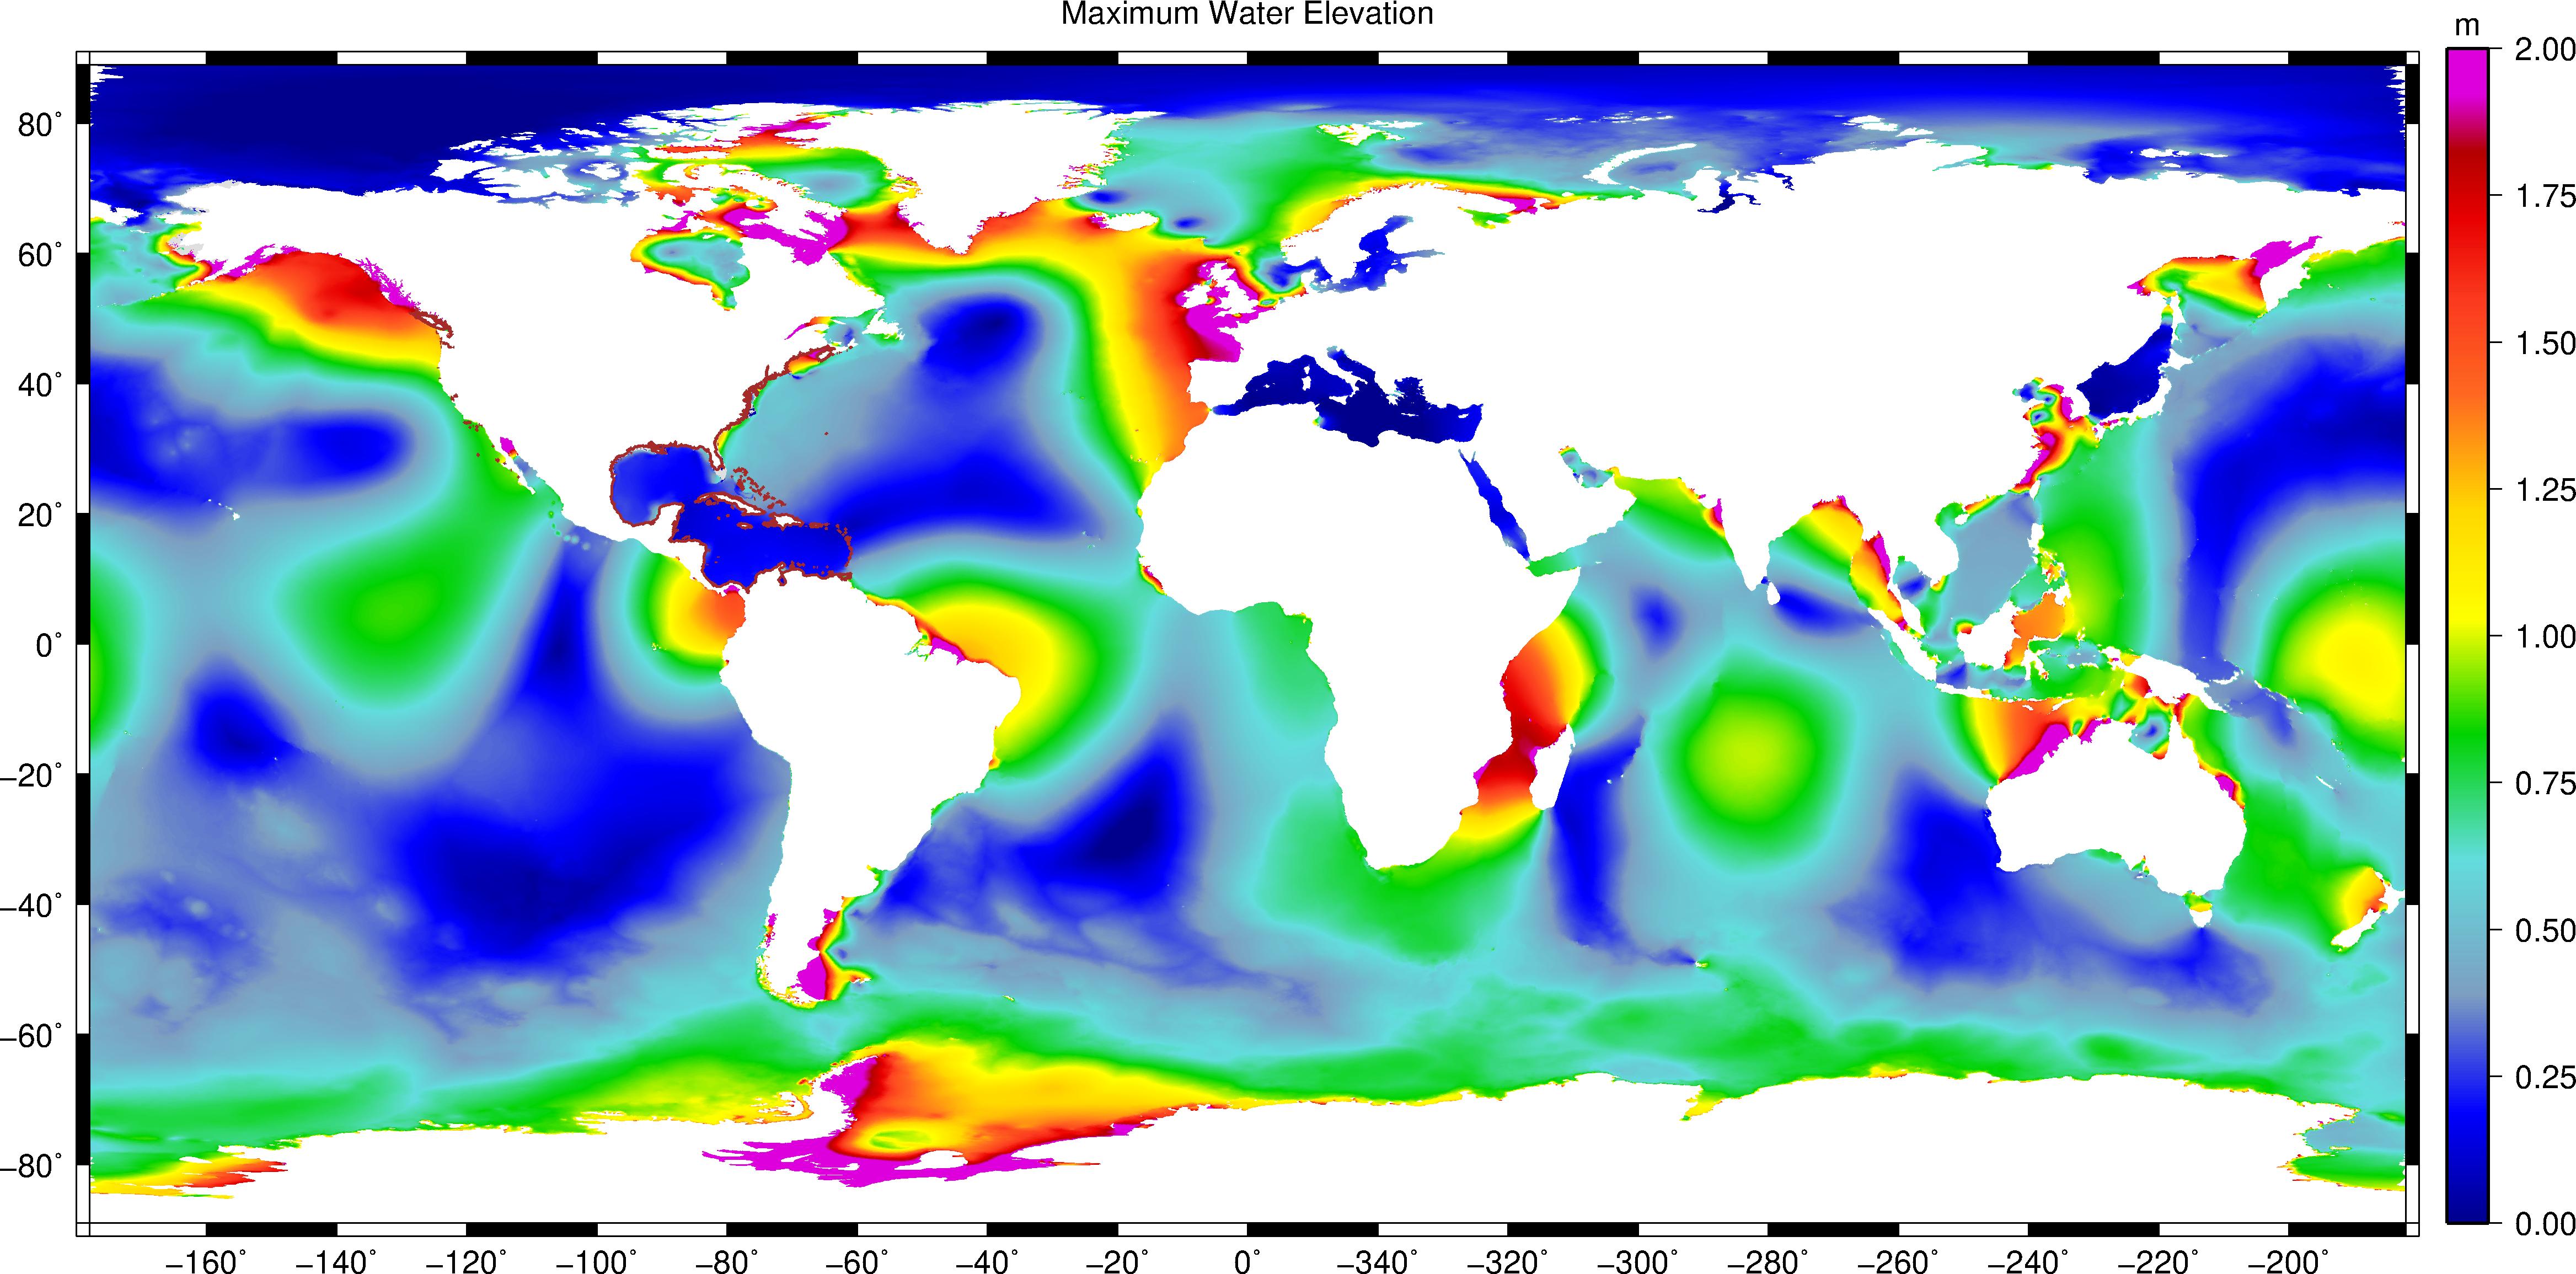
5. Maximum ADCIRC surface elevation for the 7 day forecast period (v4.1.4)
Zoom in by clicking the following locations:
・Gulf of Alaska・Corpus Christi・Port Arthur・Mississippi・Mobile・Florida・Savannah・New York・Boston・New Hampshire・Pacific islands
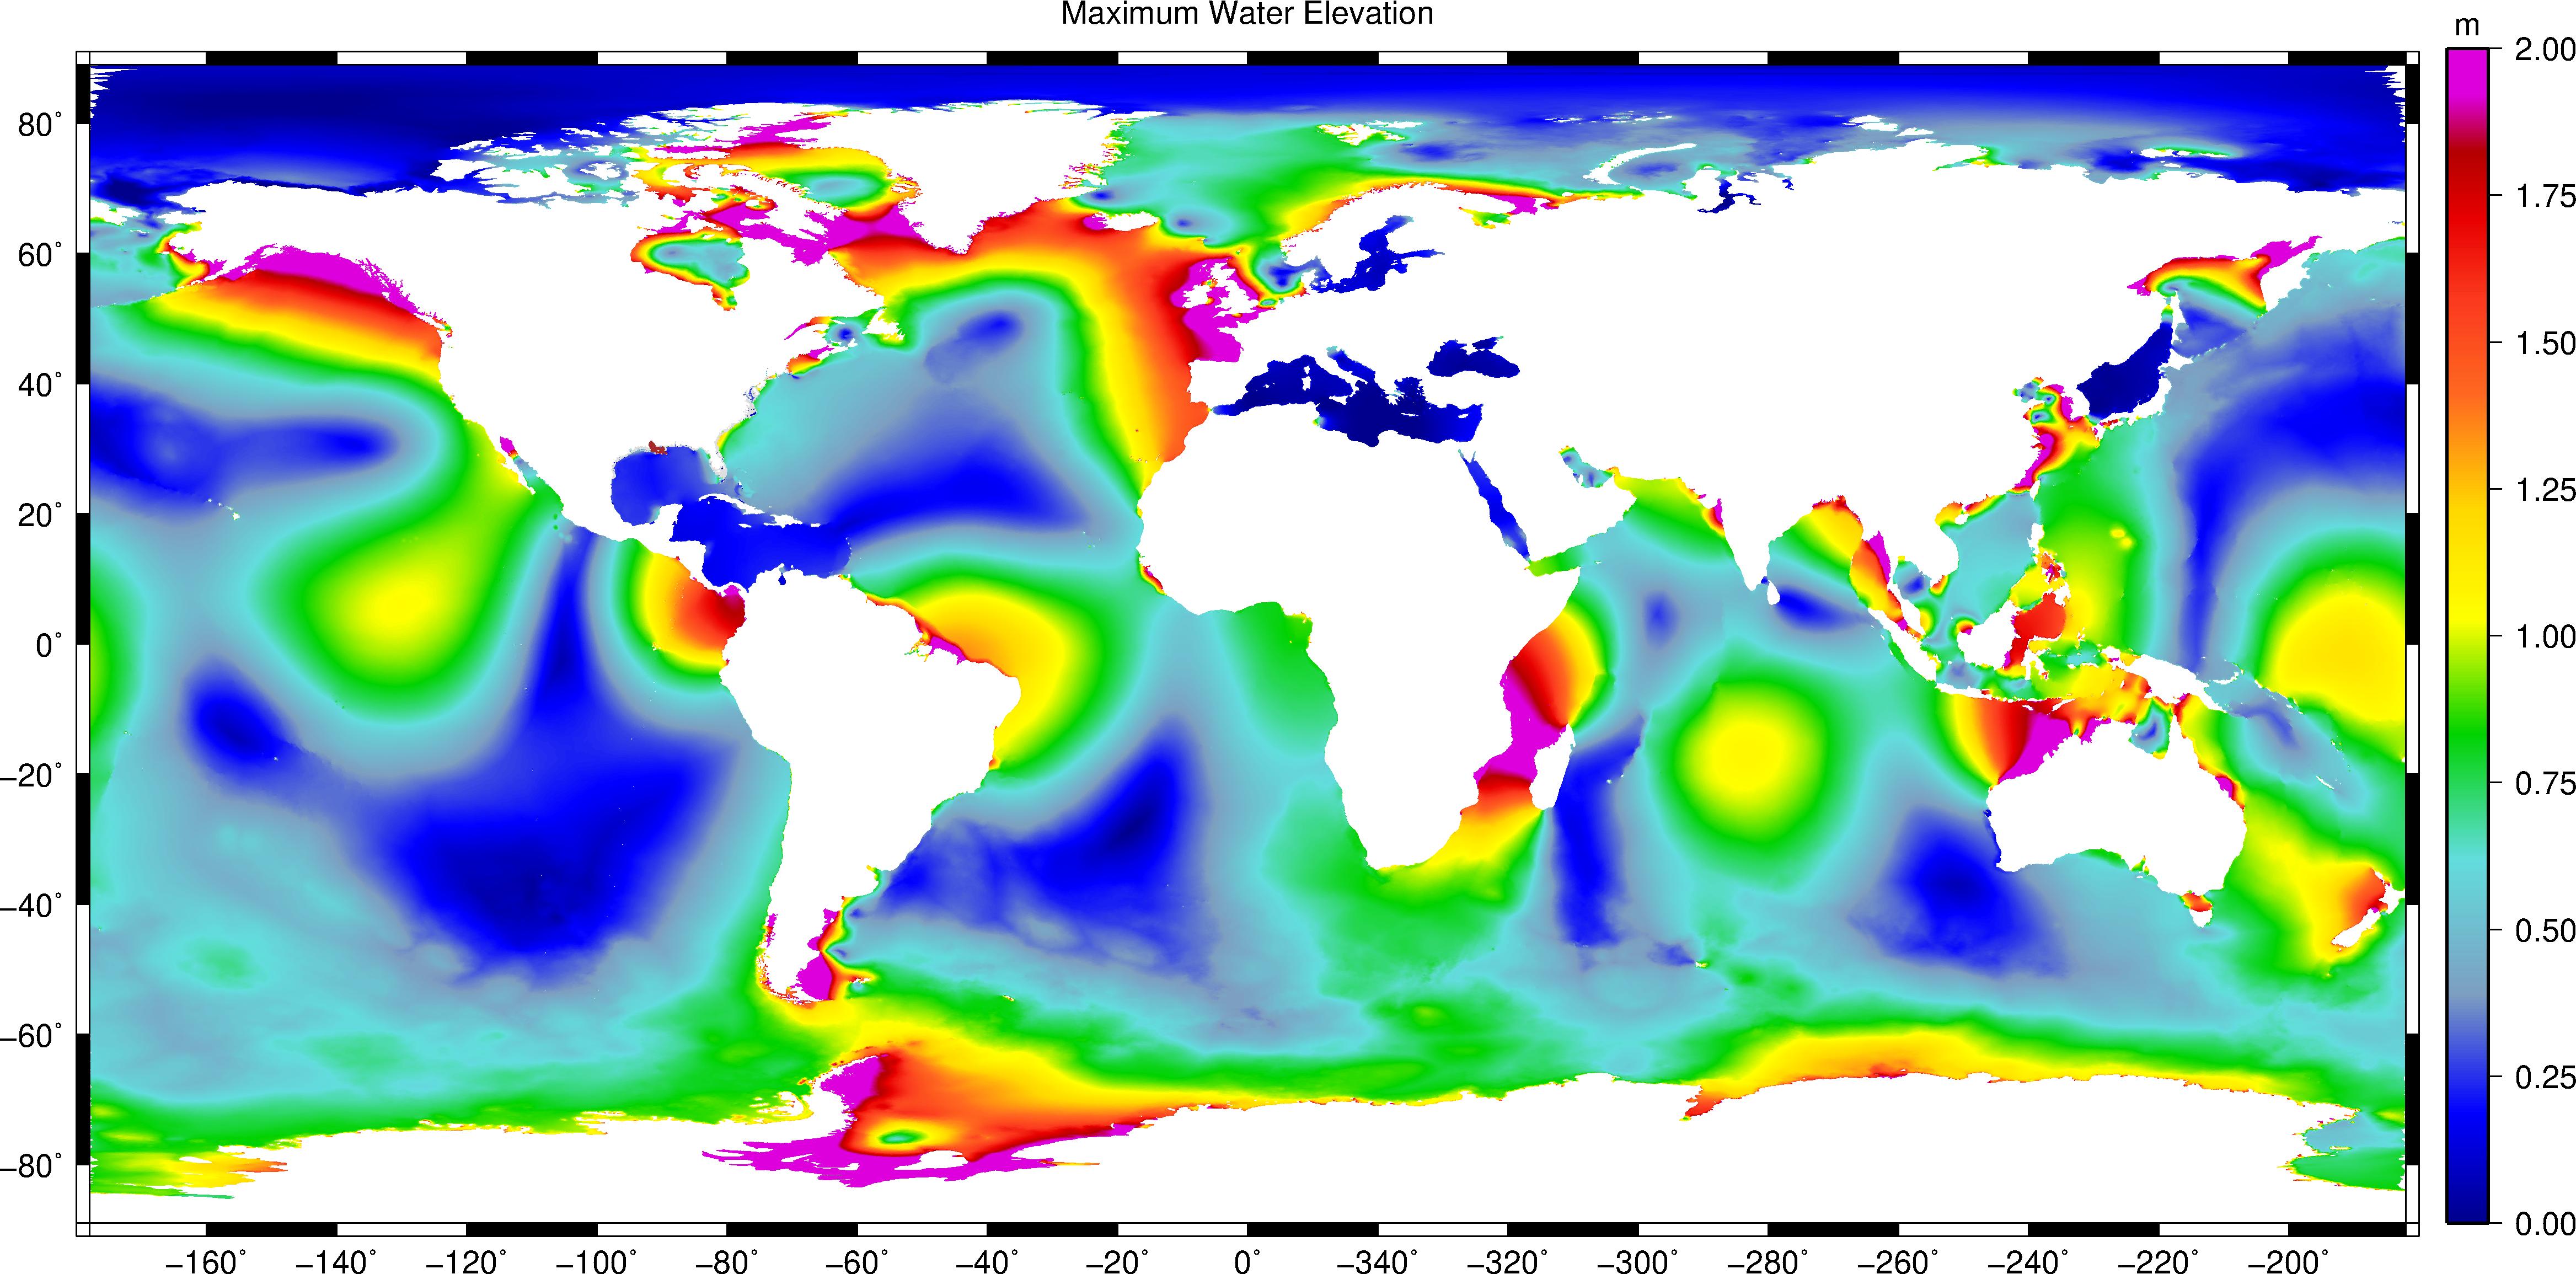
6. Maximum ADCIRC surface elevation for the 7 day forecast period (v5)
Zoom in by clicking the following locations:
・Gulf of Alaska・Corpus Christi・Port Arthur・Mississippi・Mobile・Florida・Savannah・New York・Boston・New Hampshire・Pacific islands
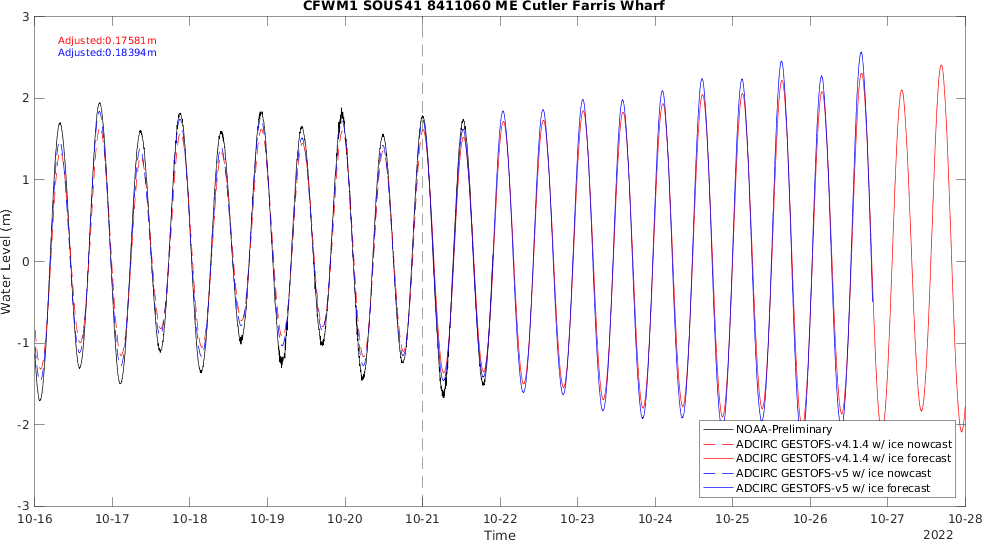
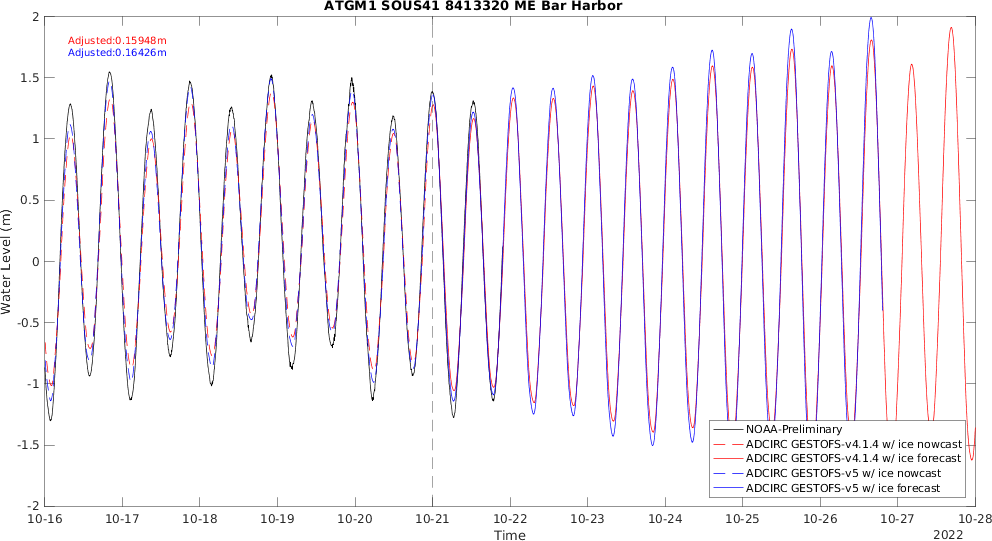
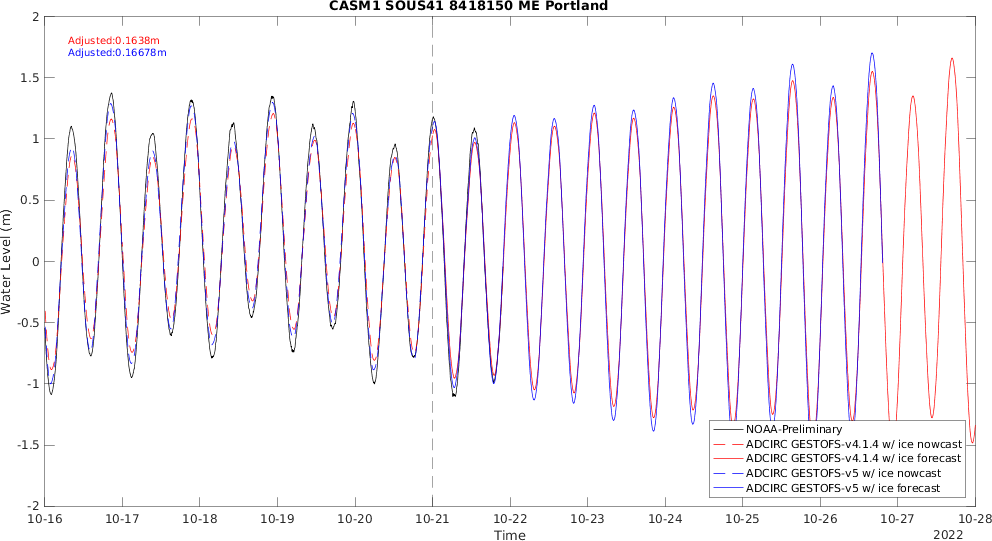
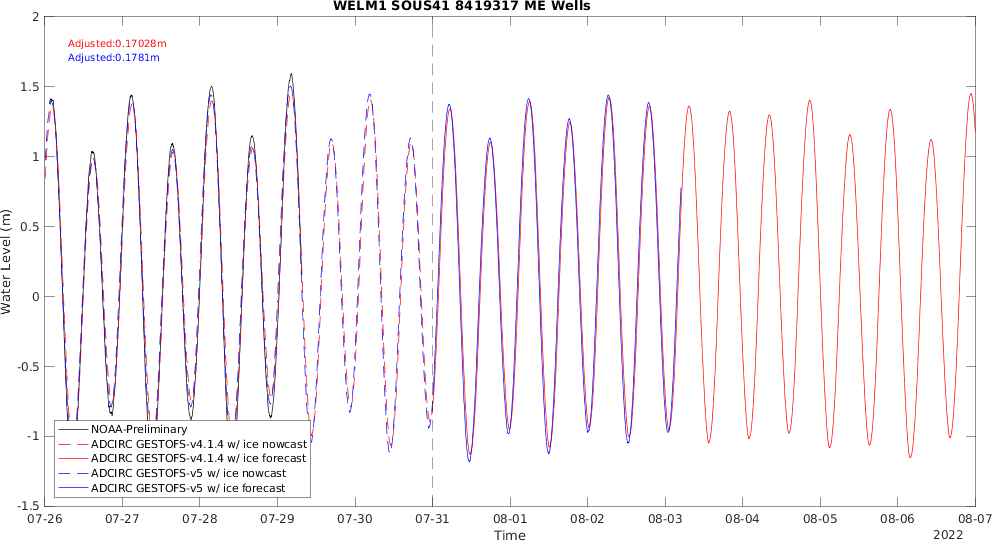
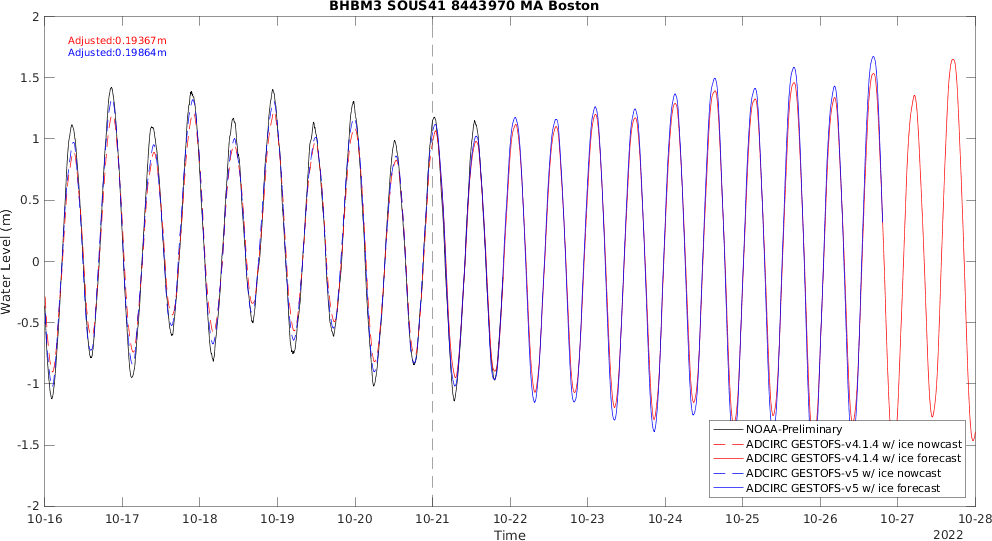
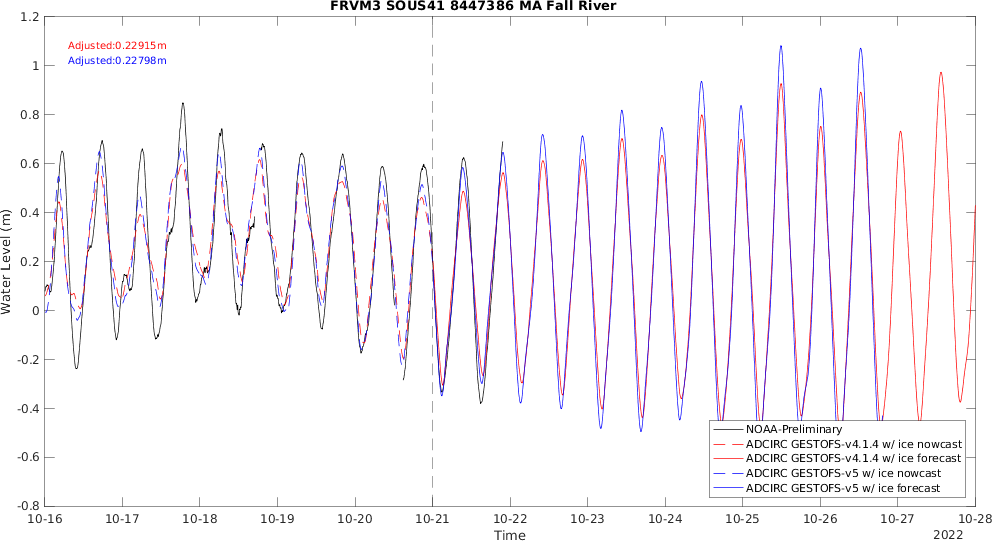
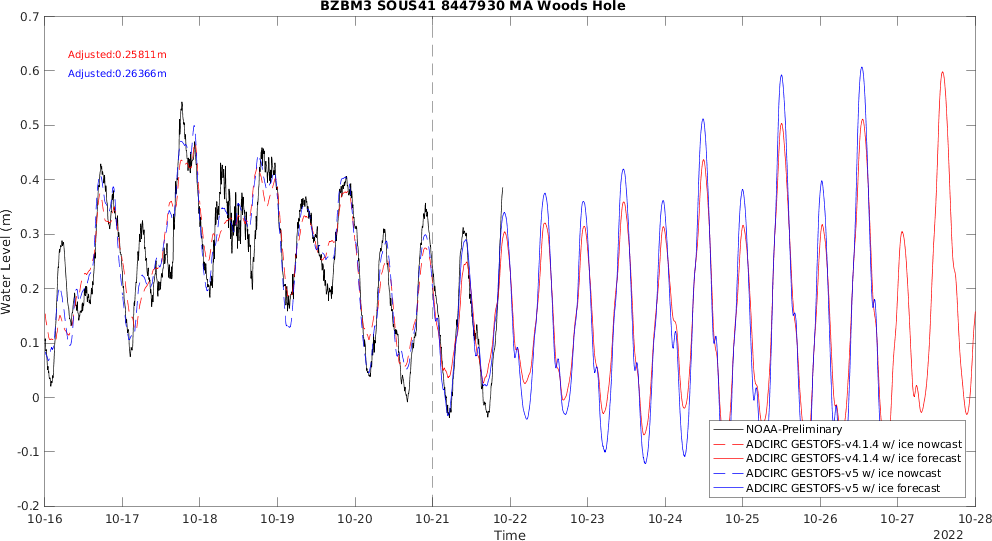
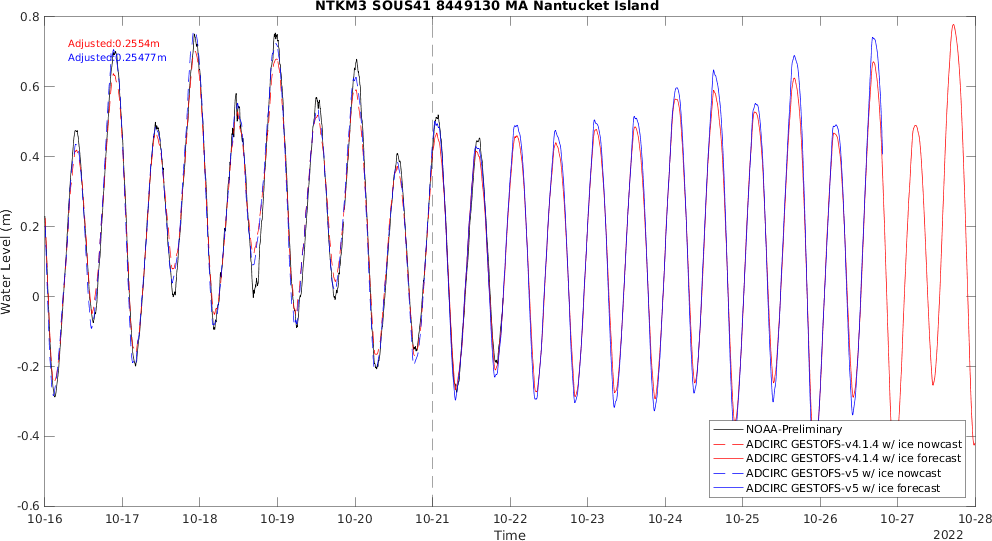
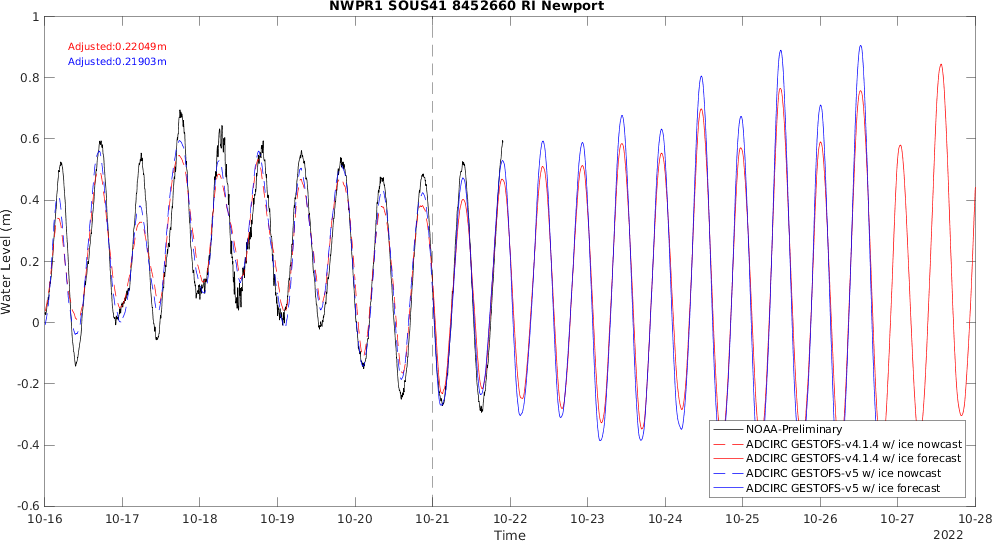
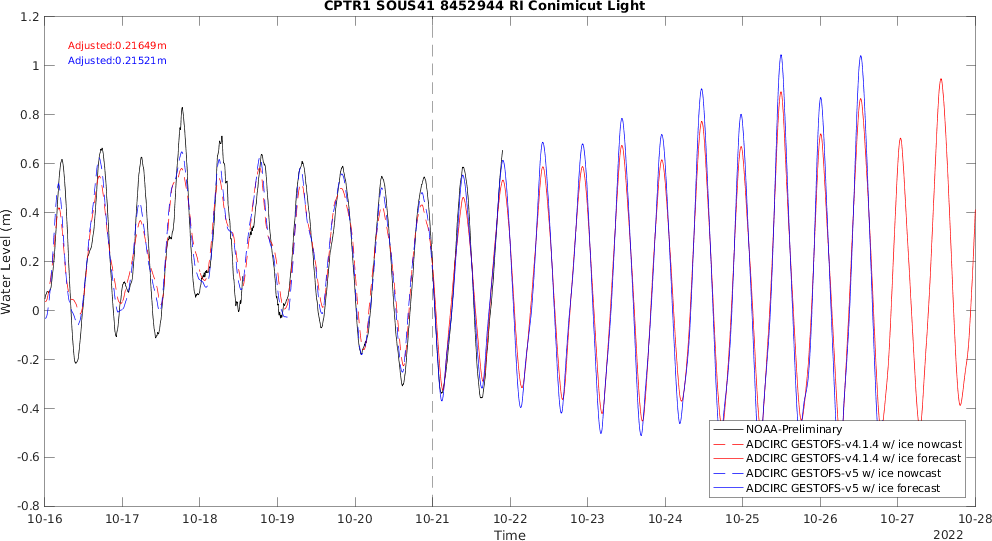
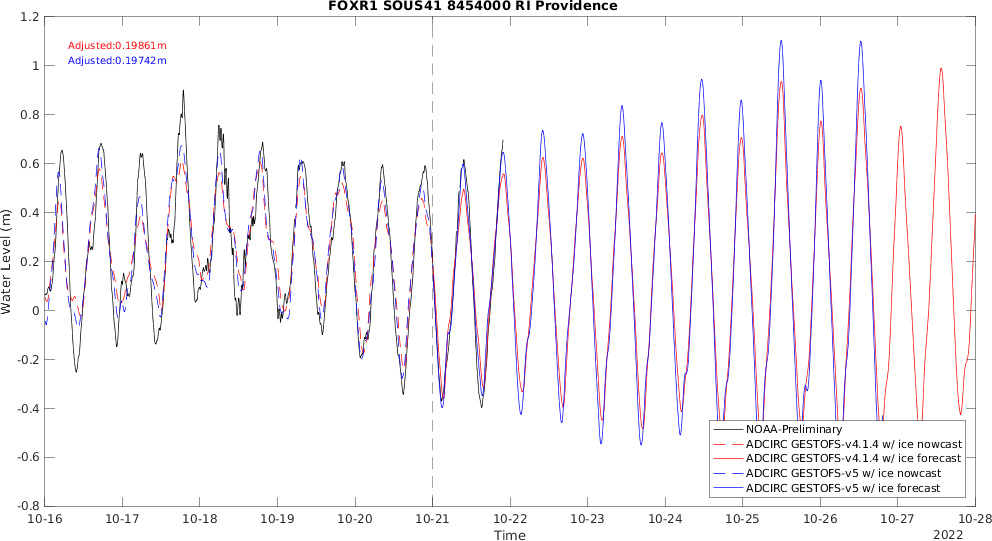
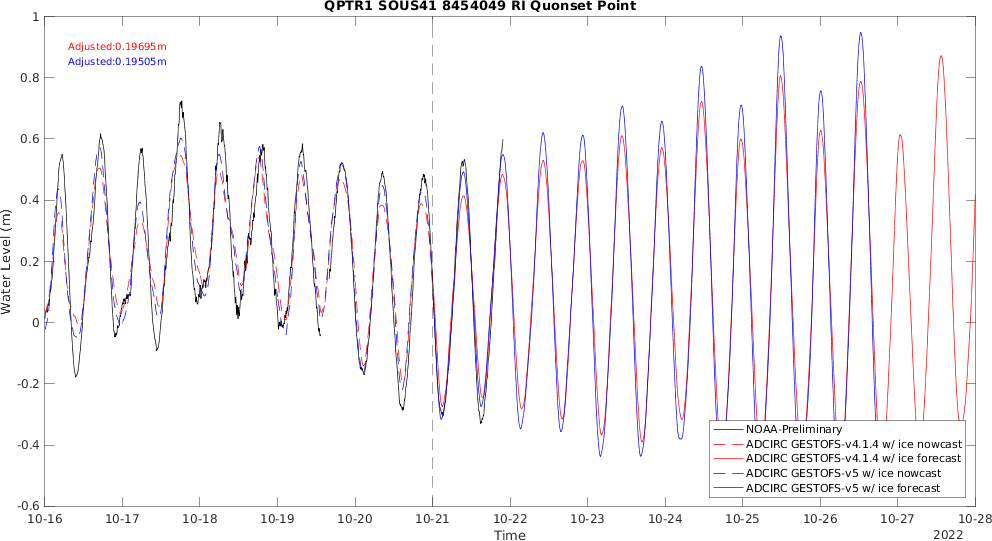
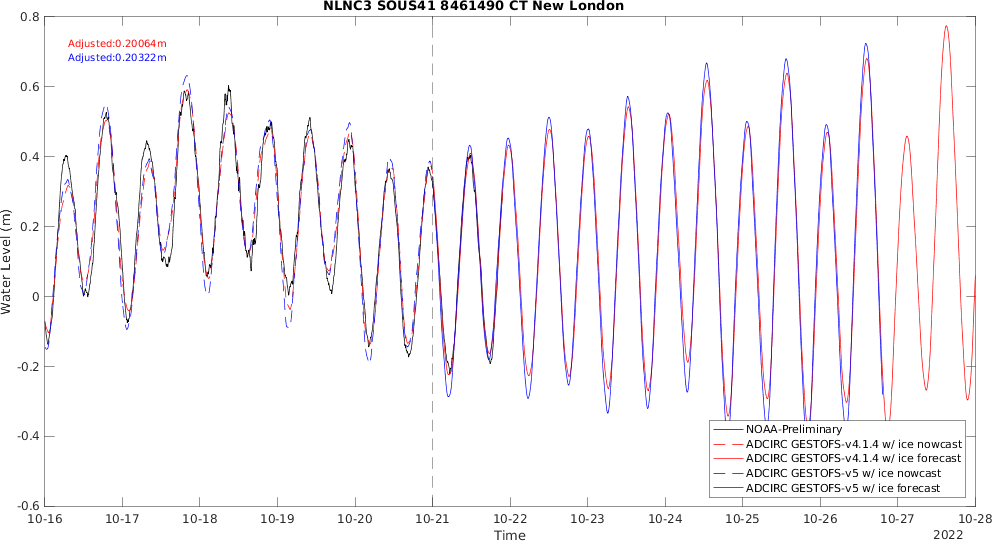
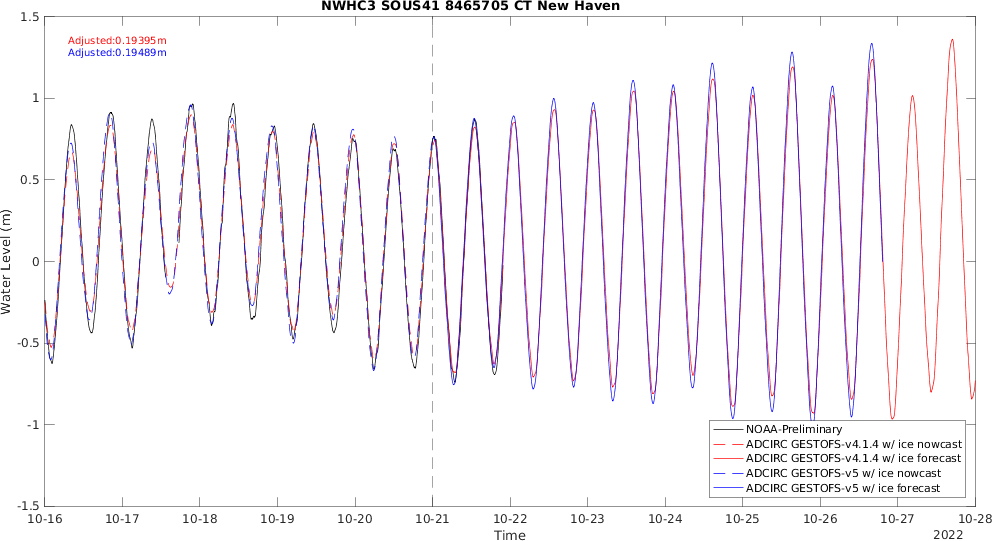
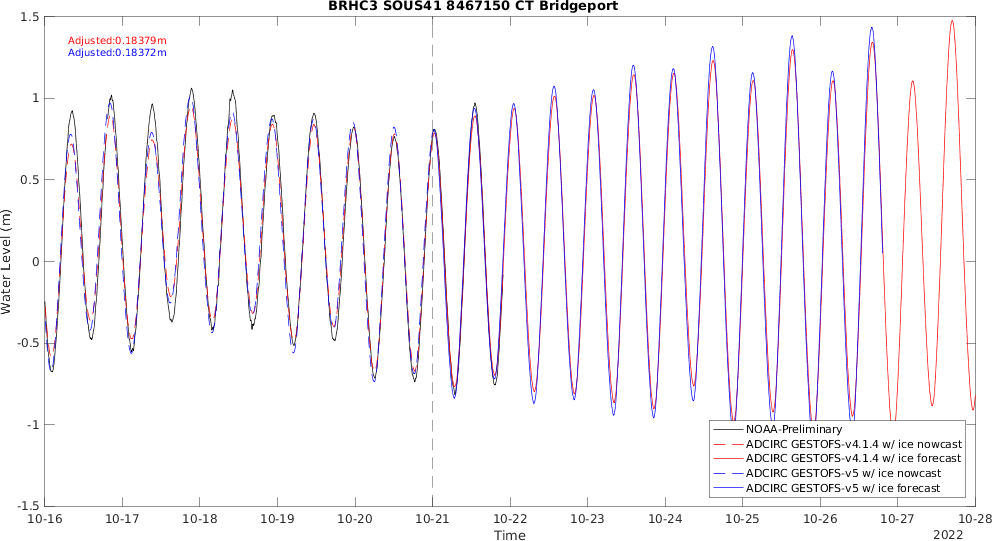
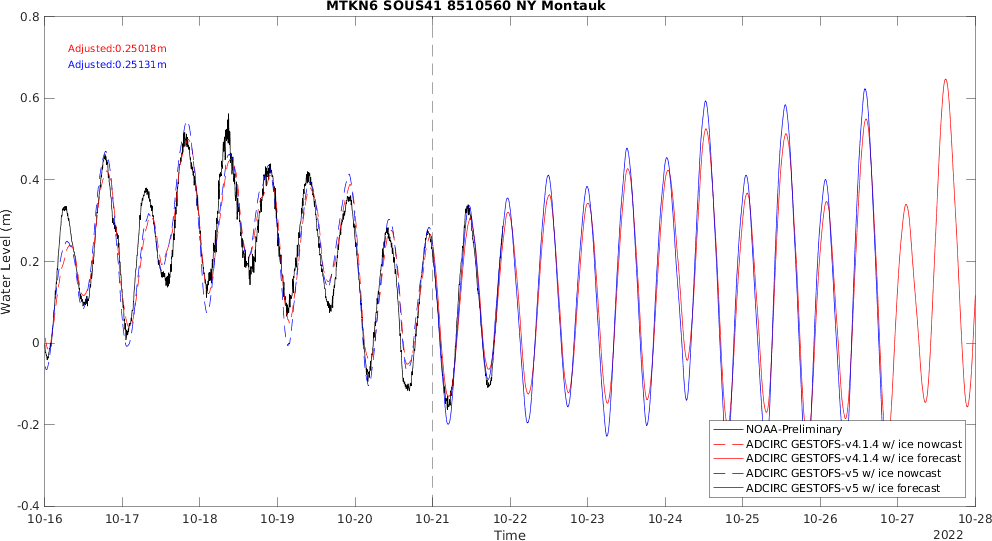
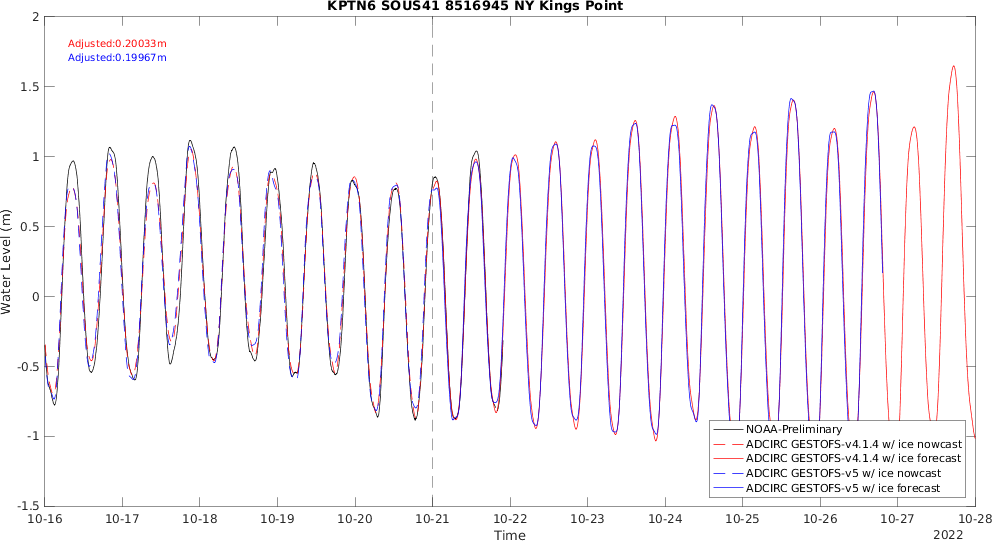
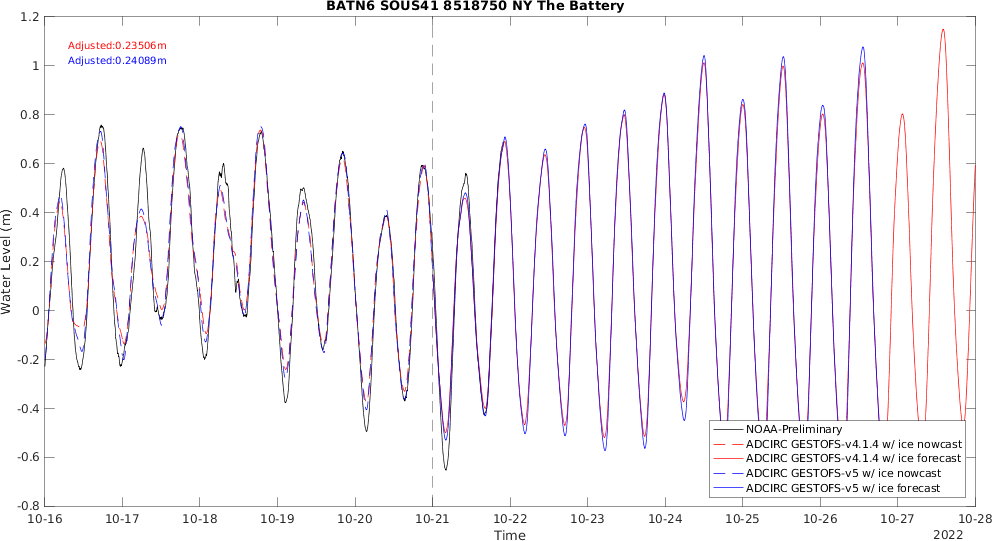
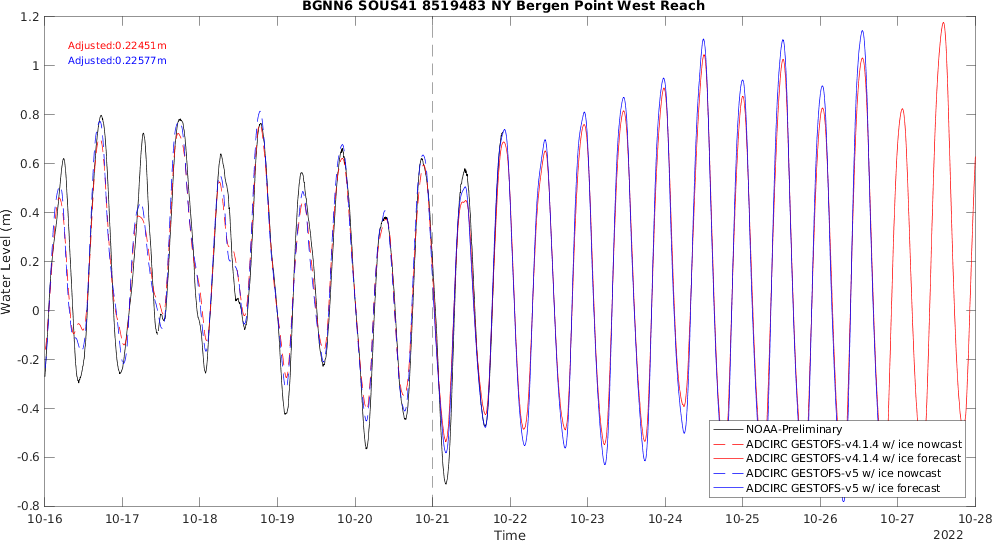
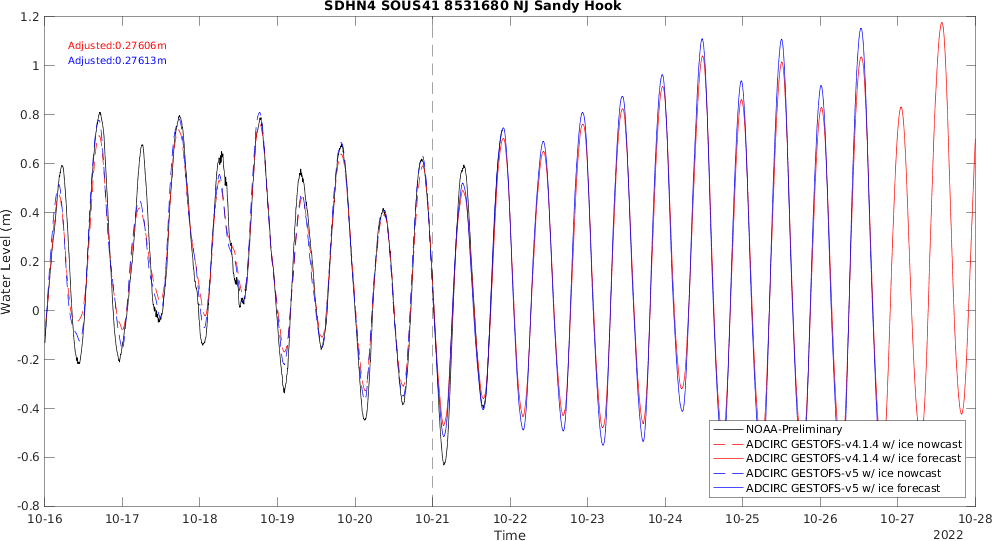
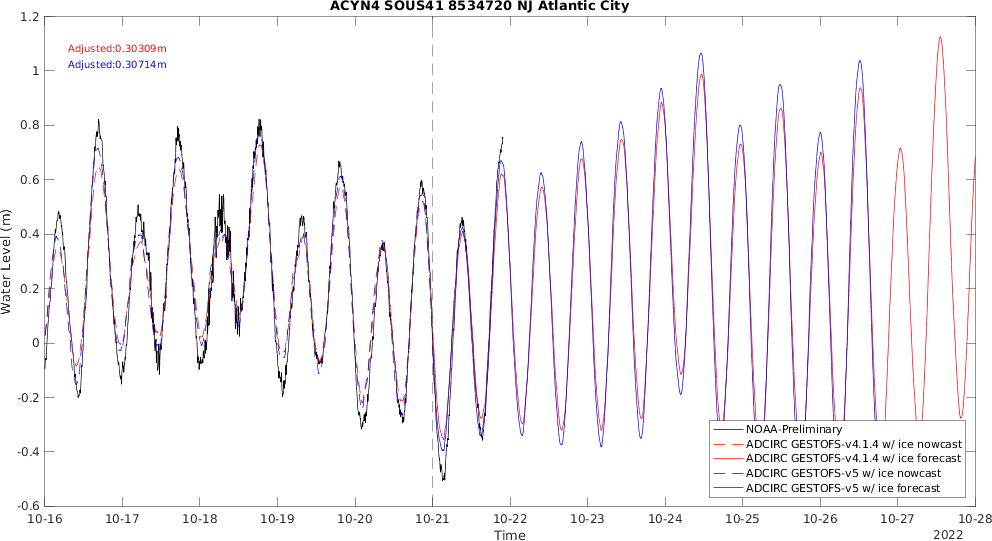
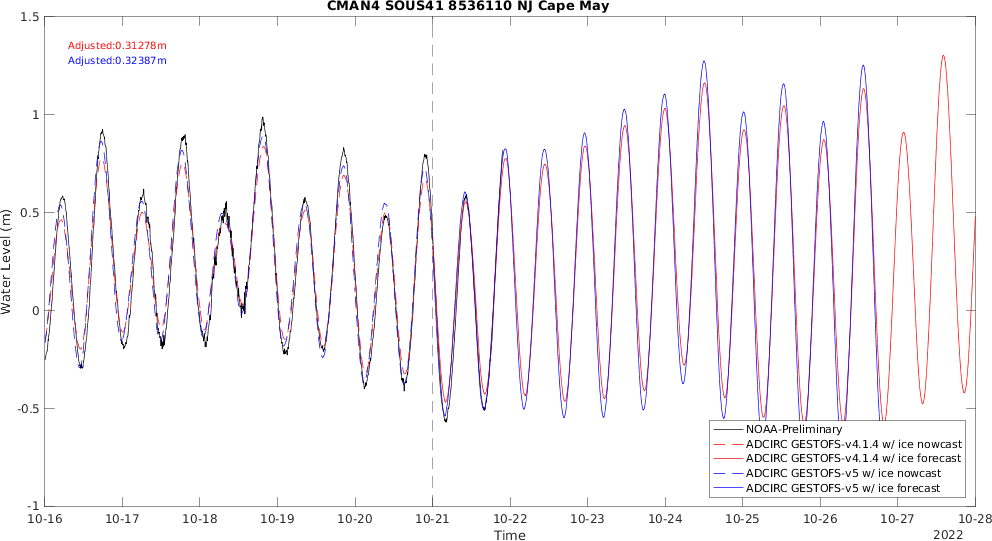
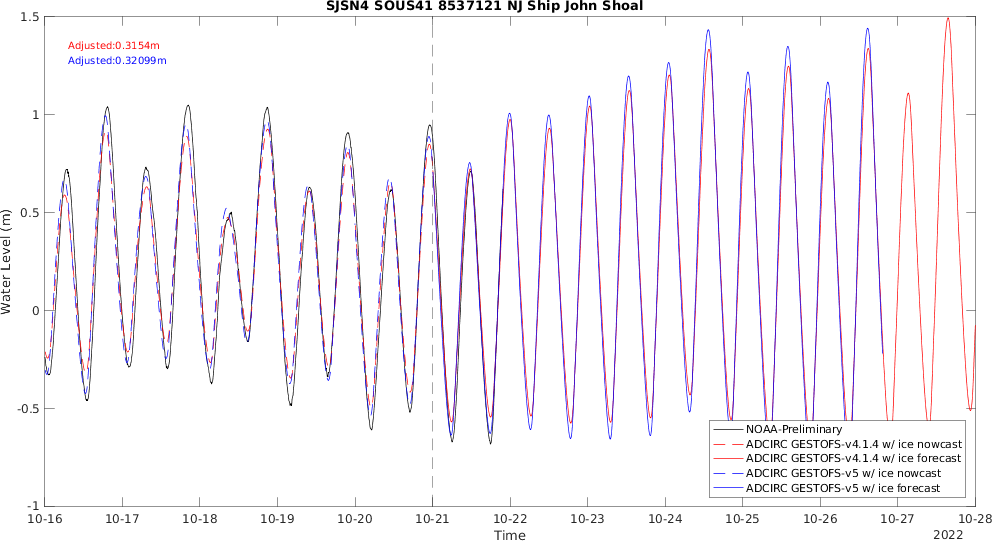
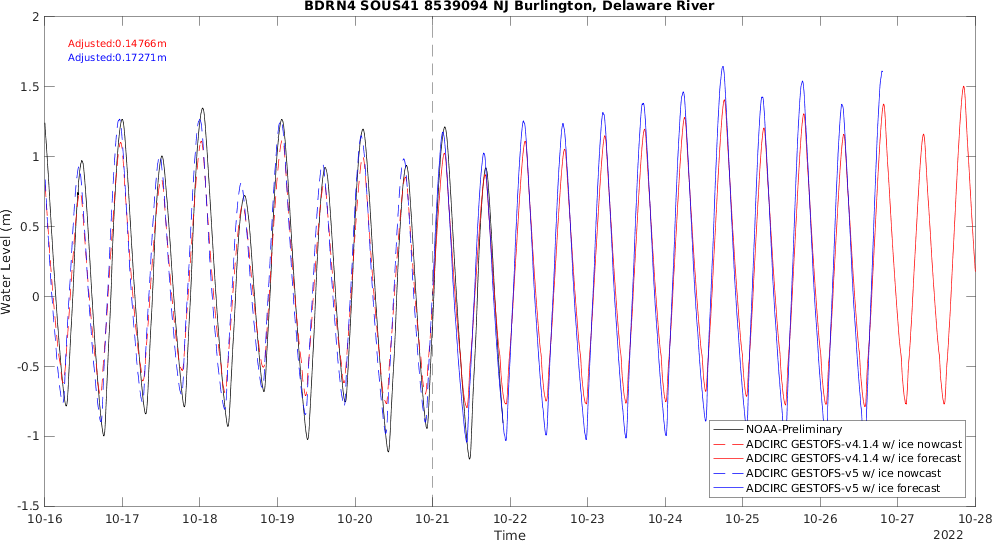
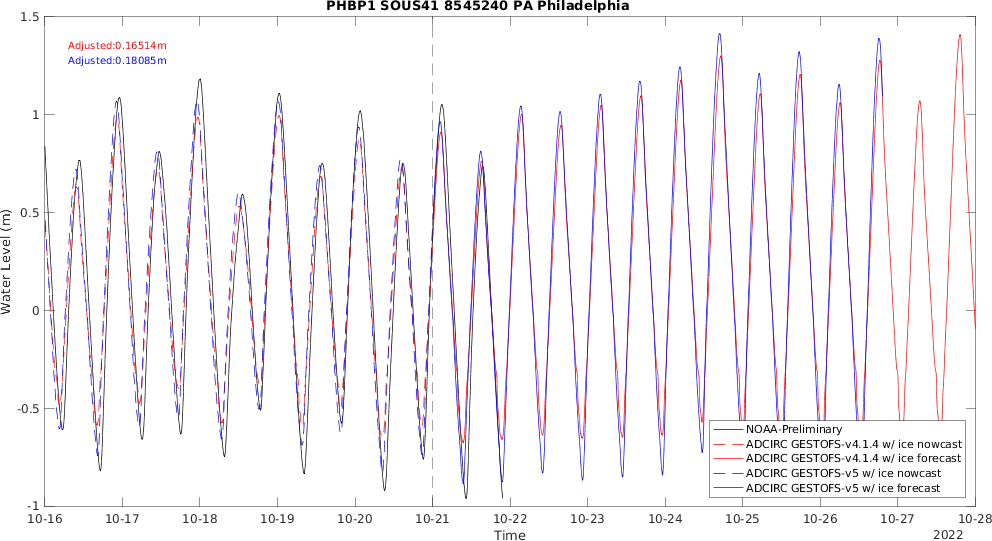
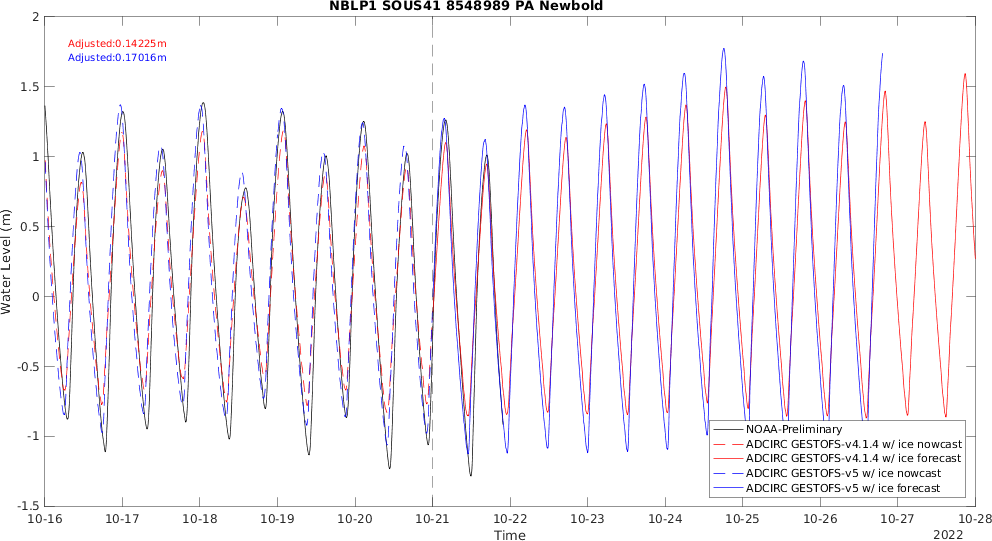
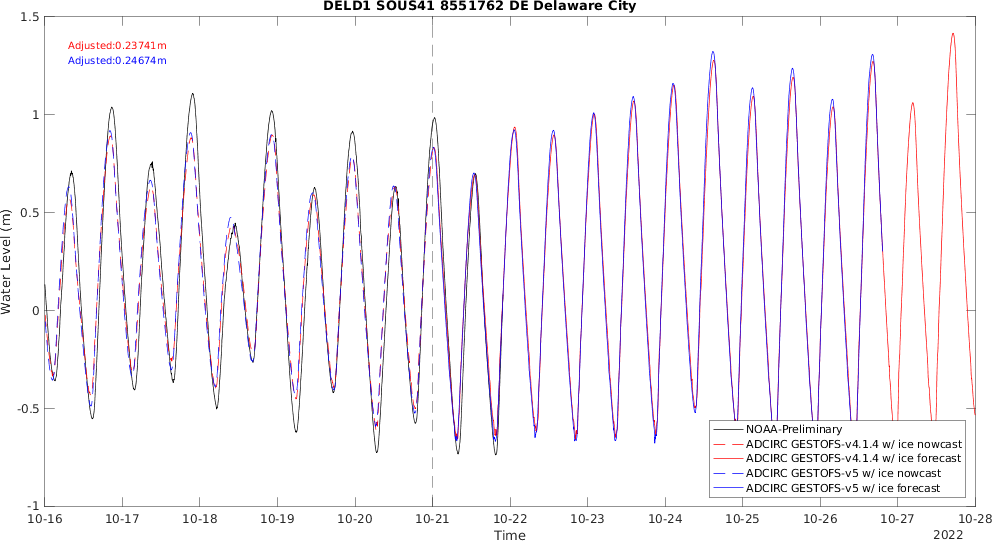
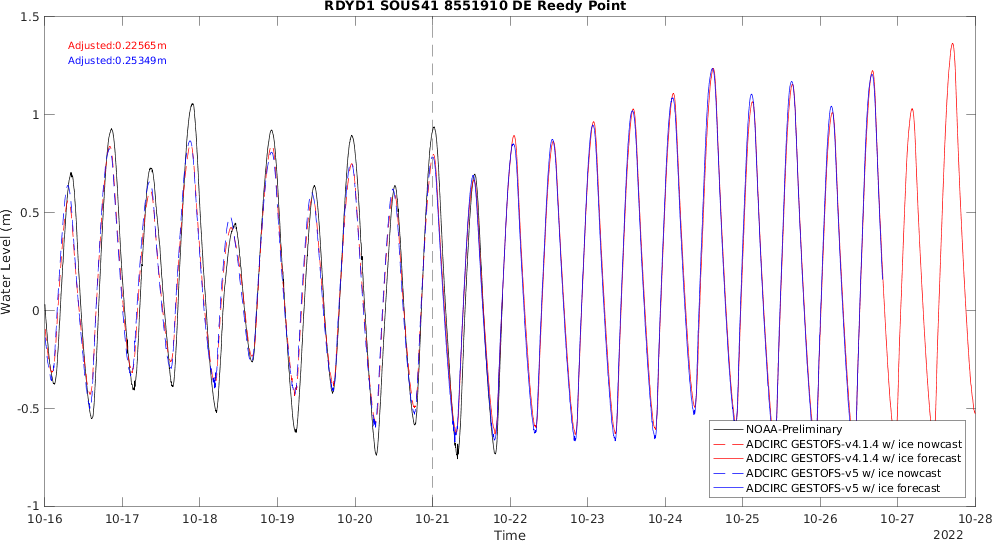
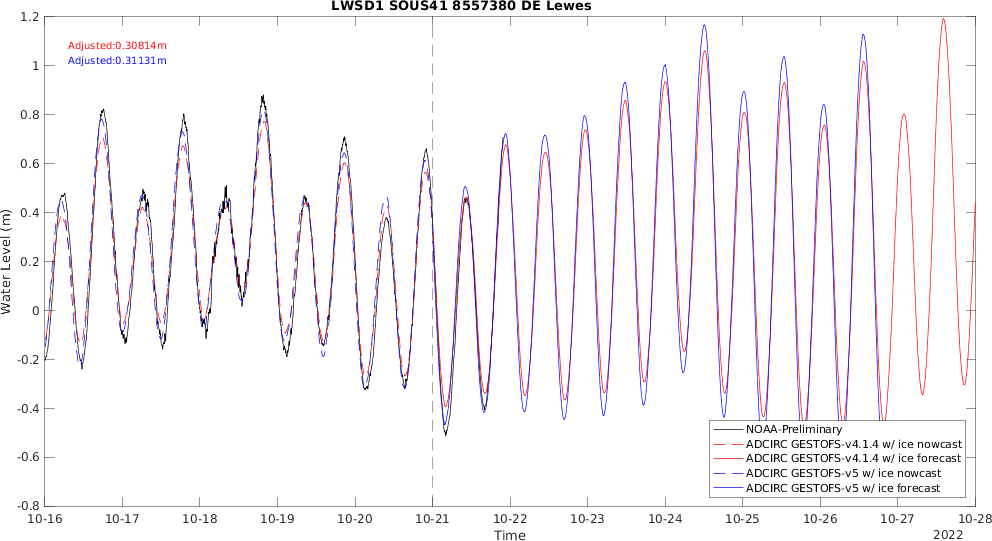
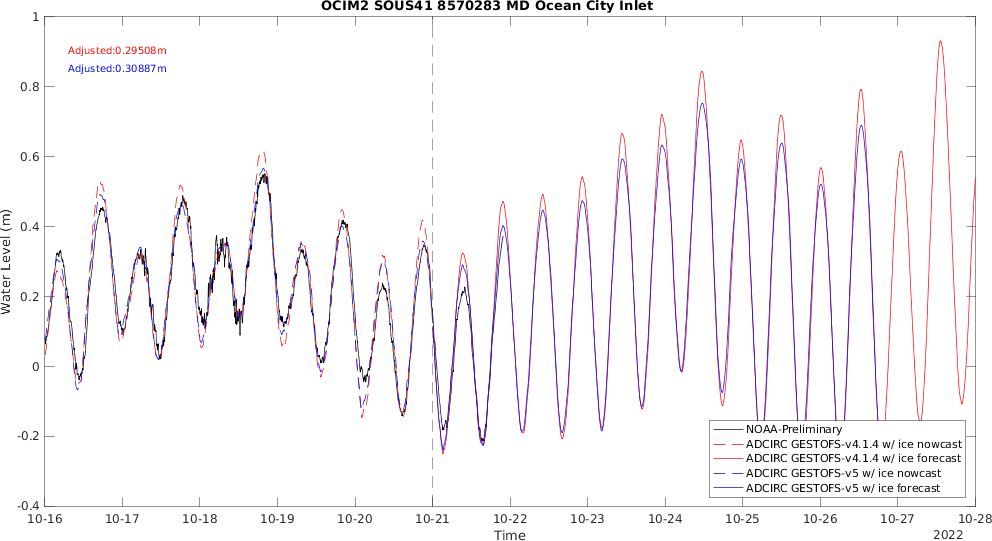
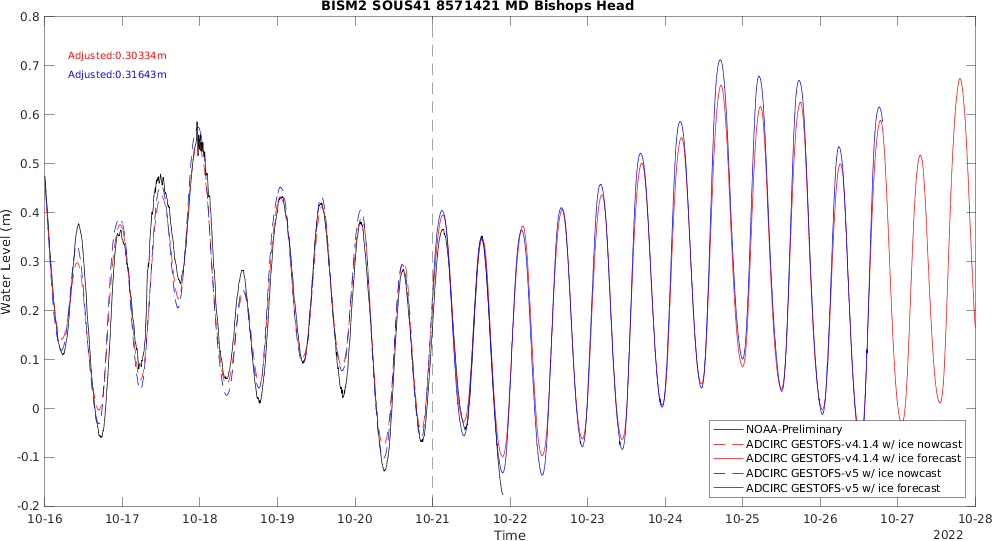
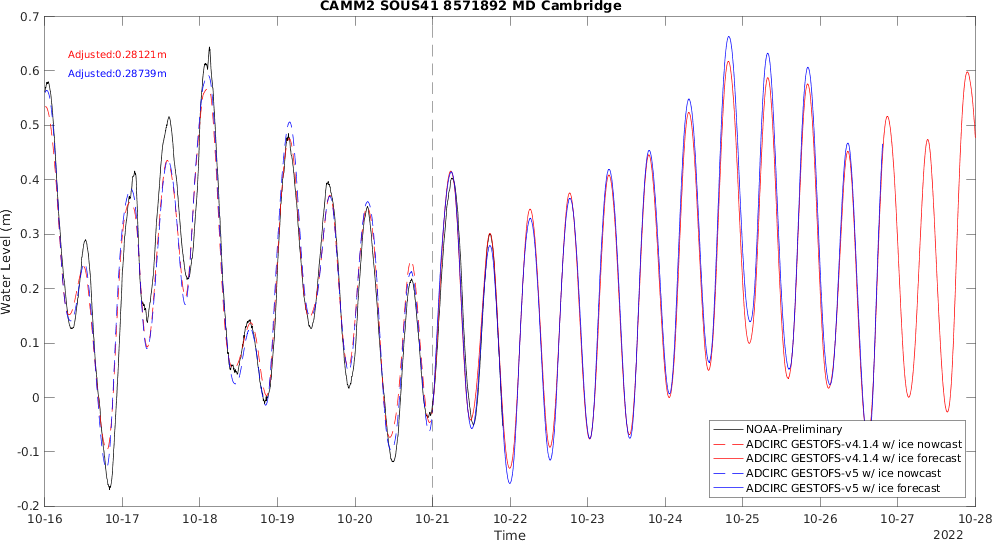
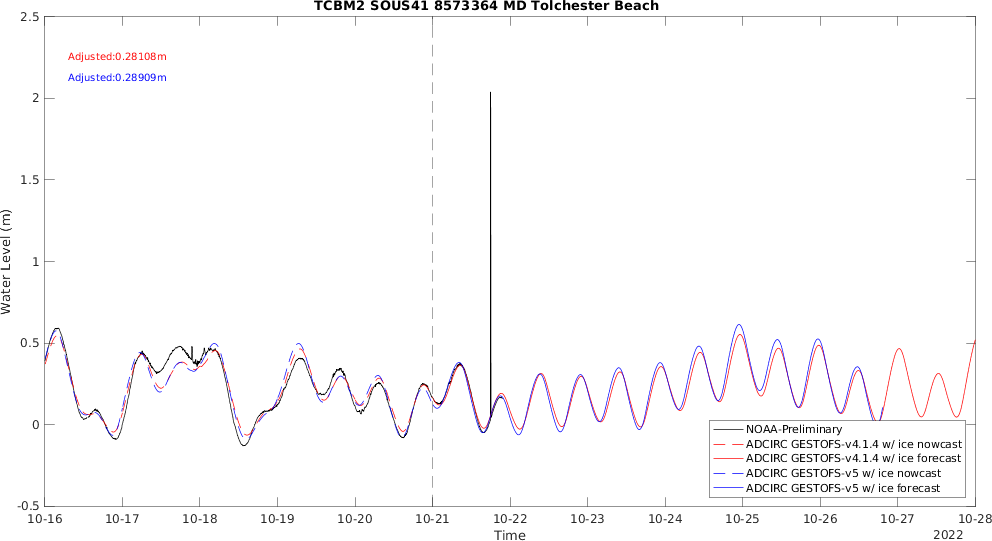
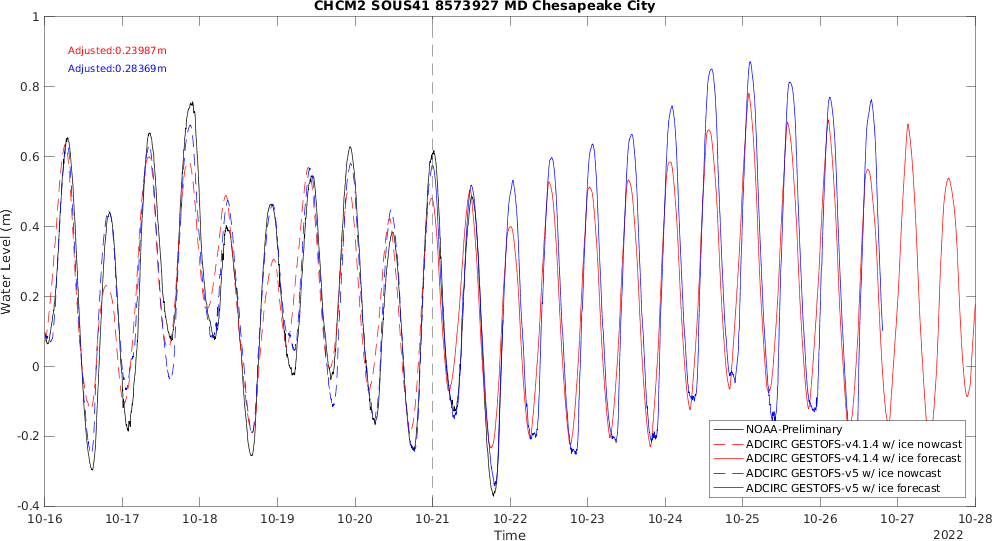
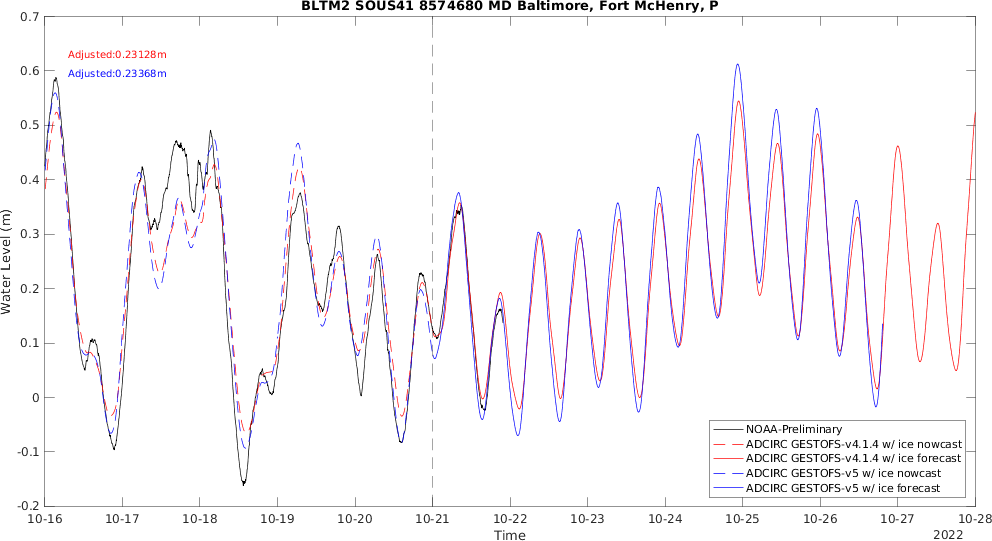
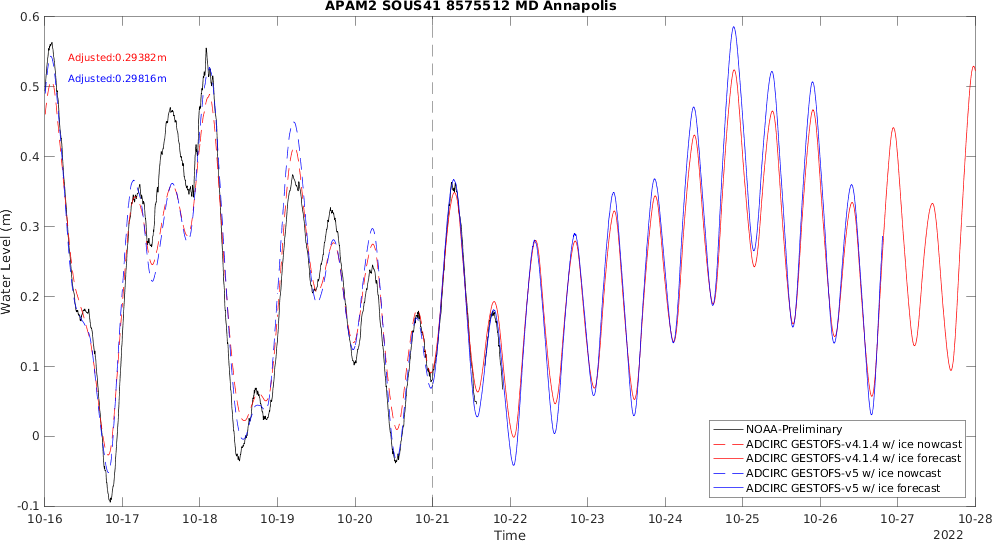
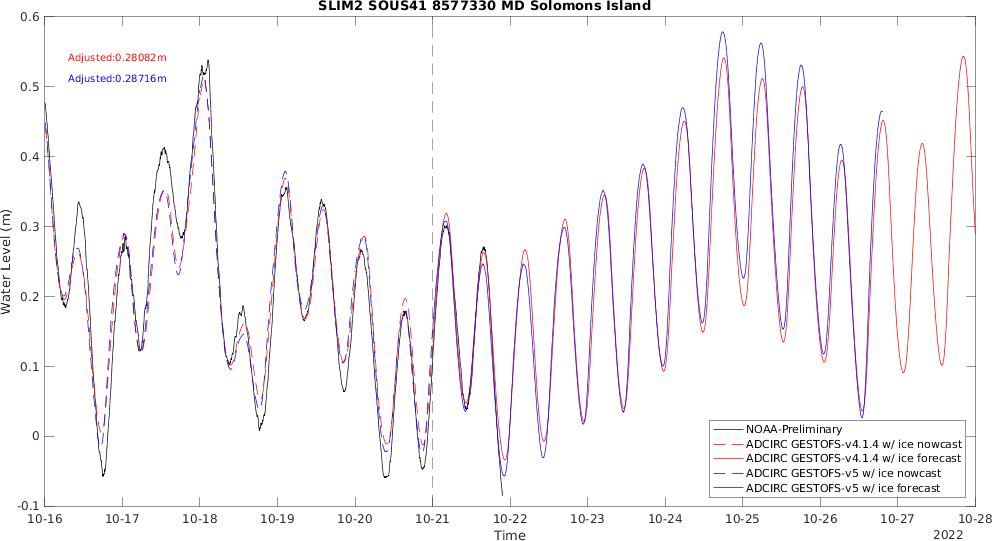
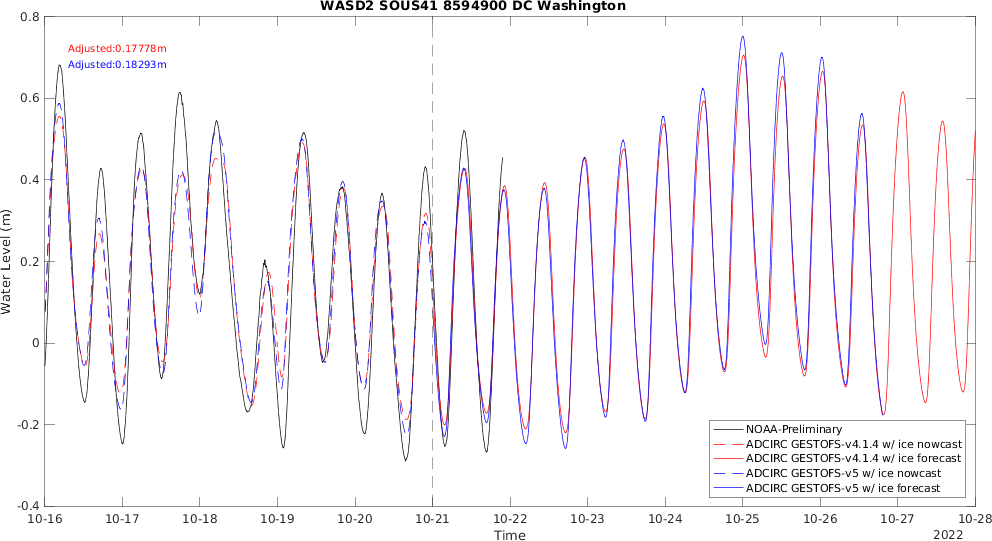
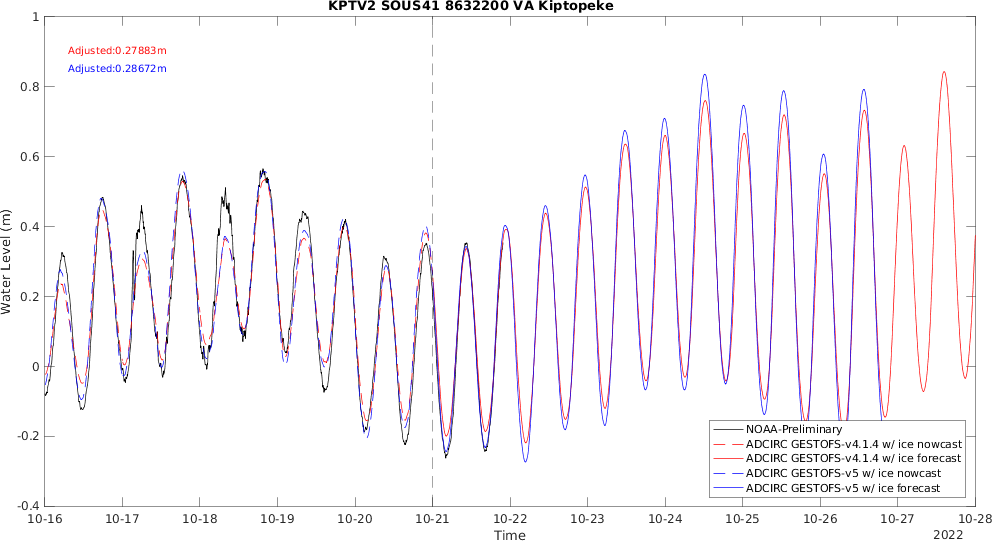
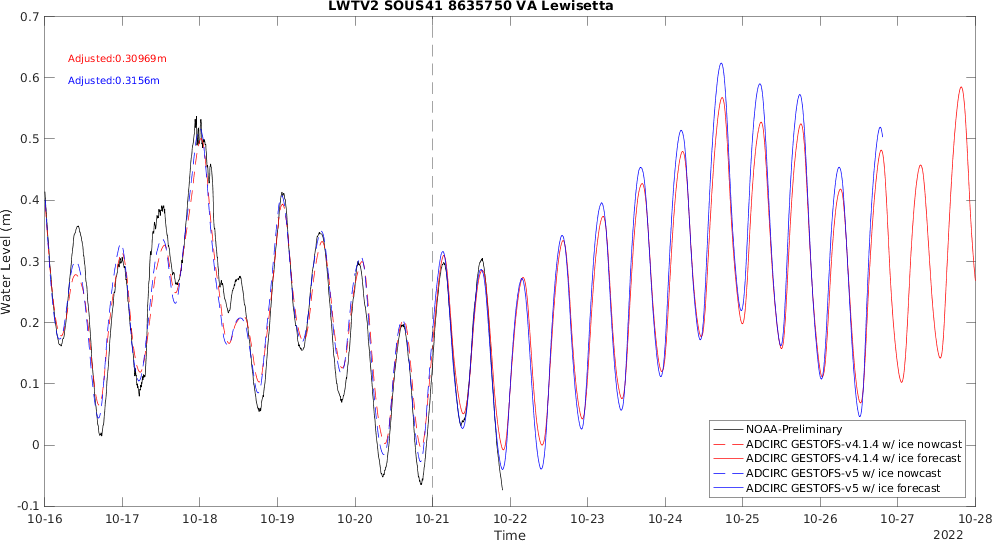
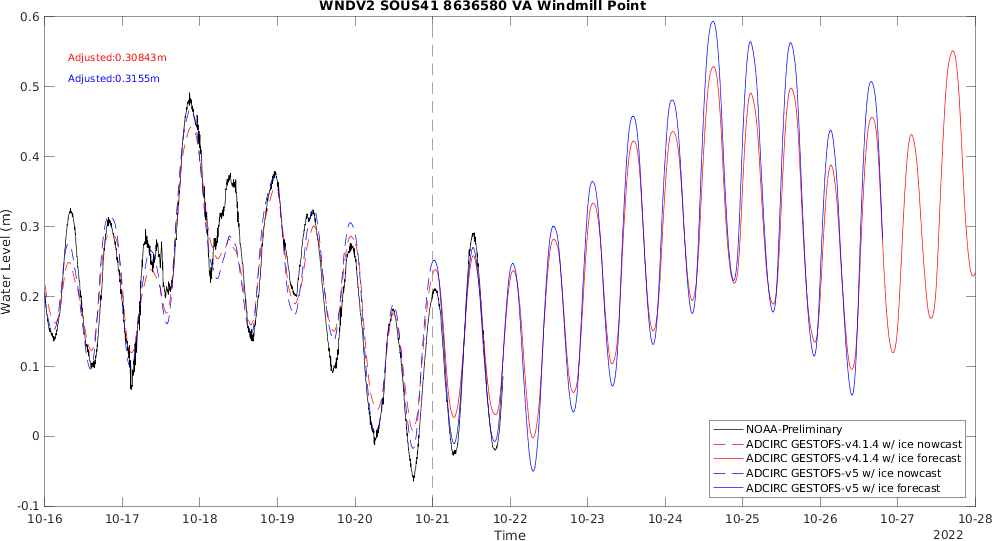
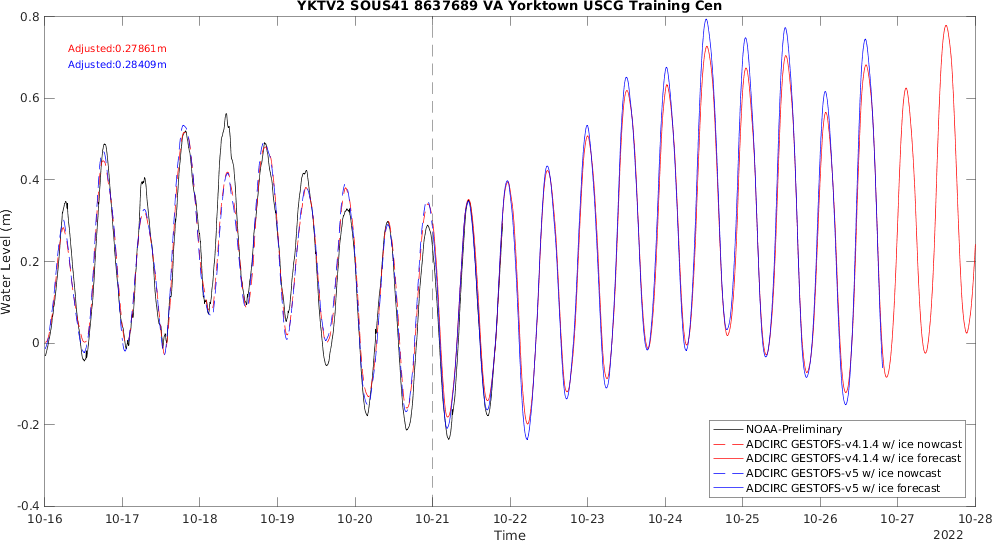
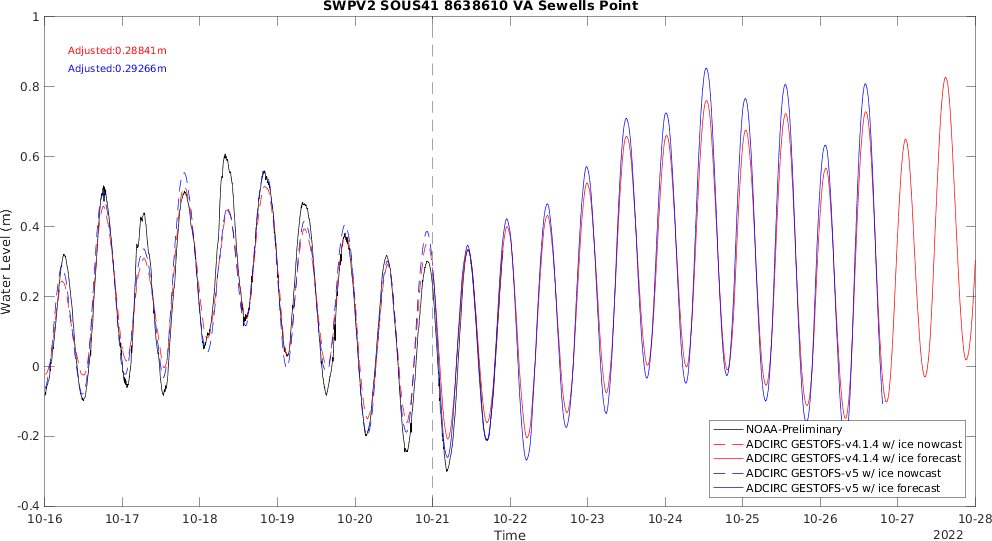
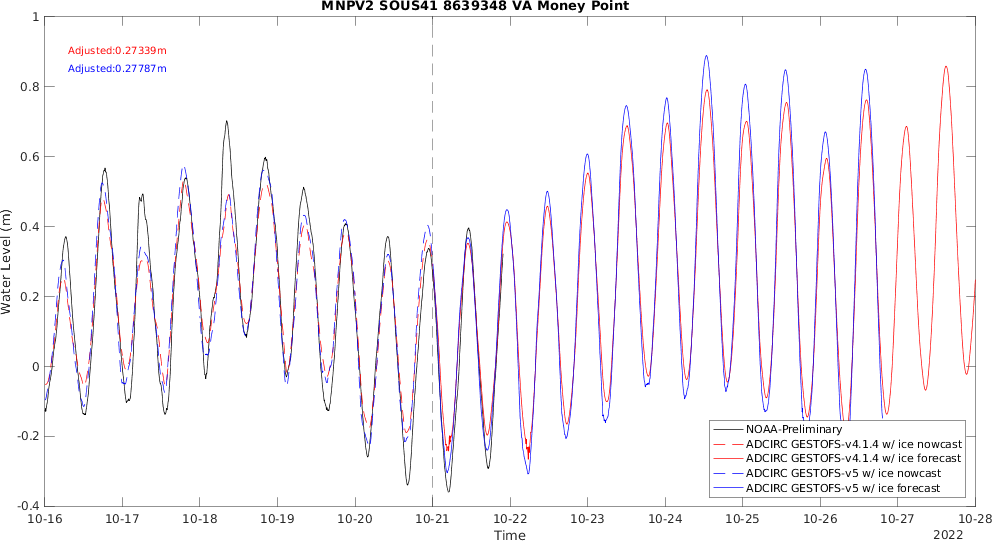
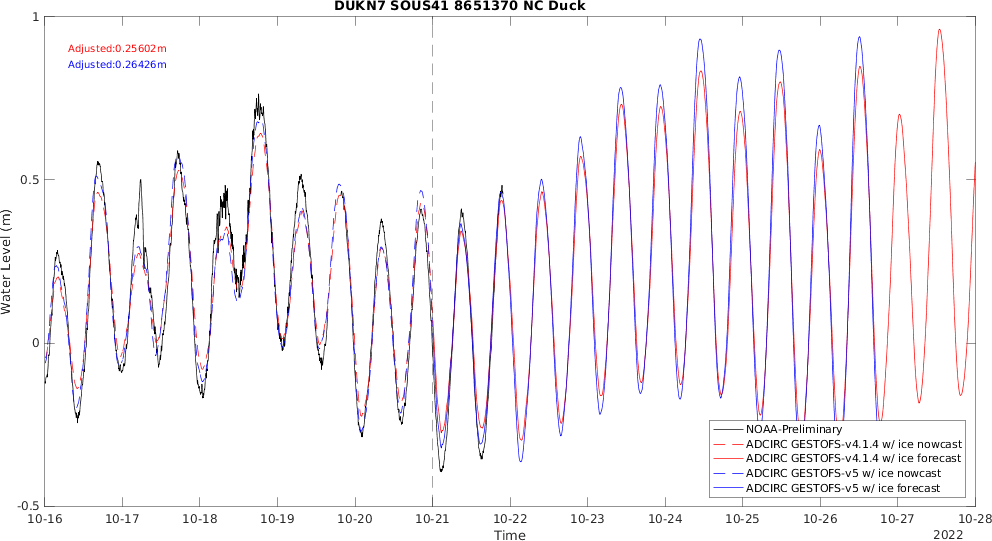
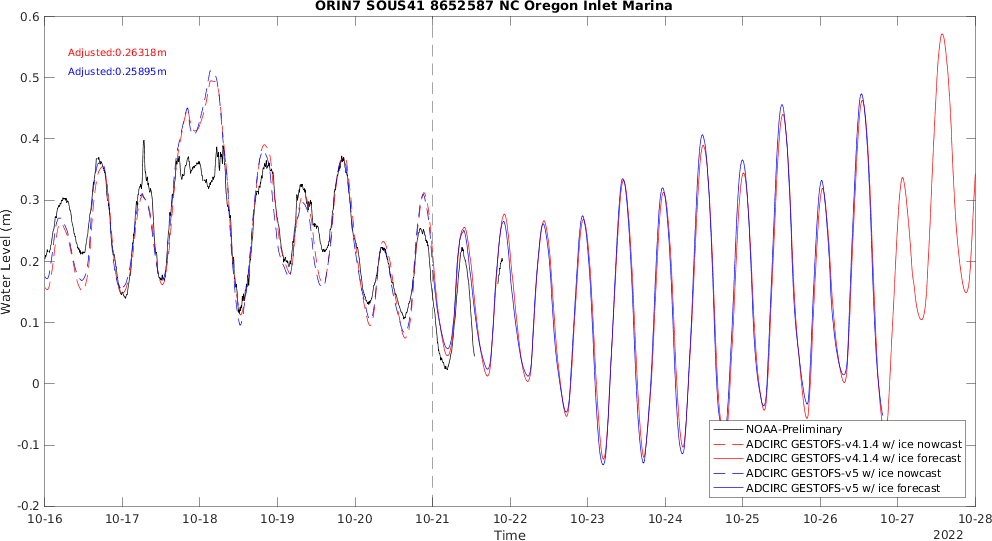
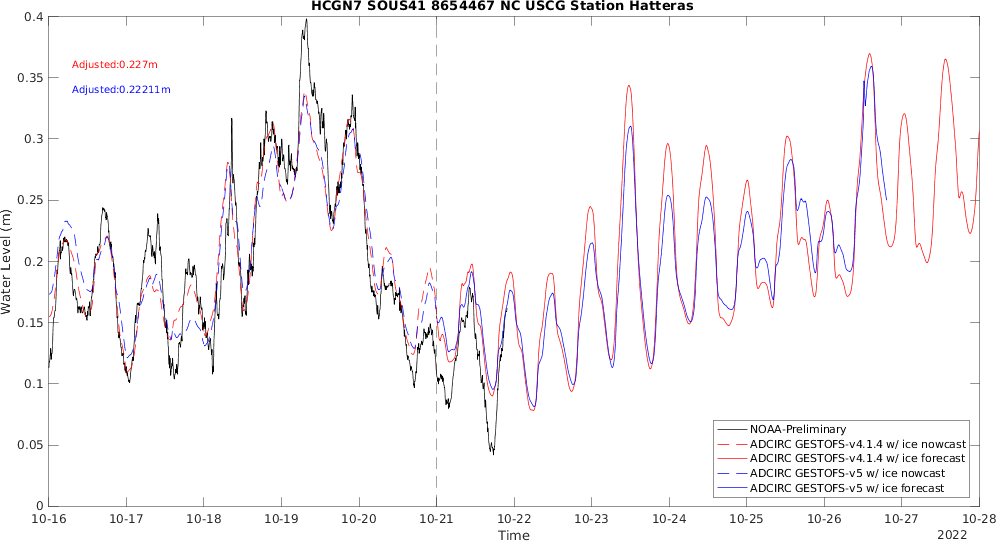
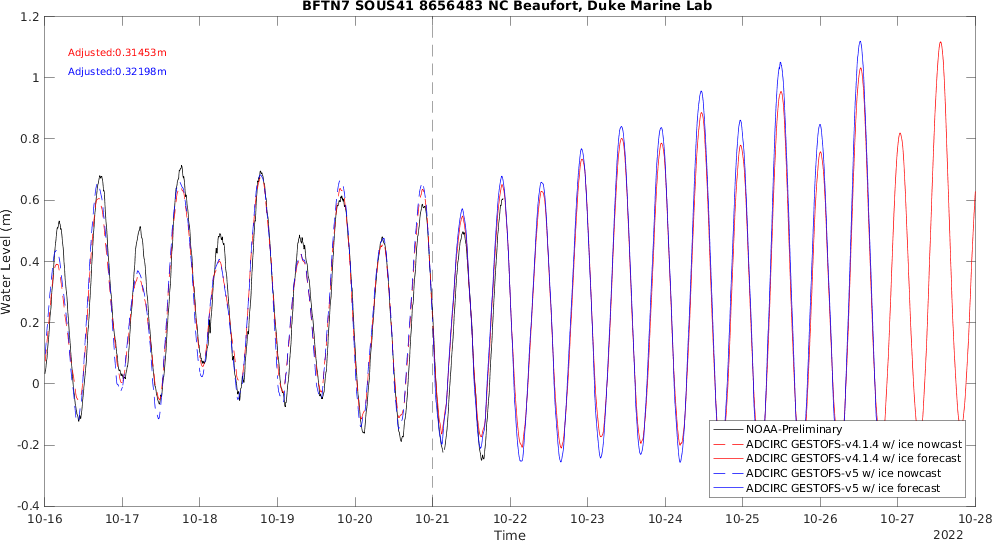
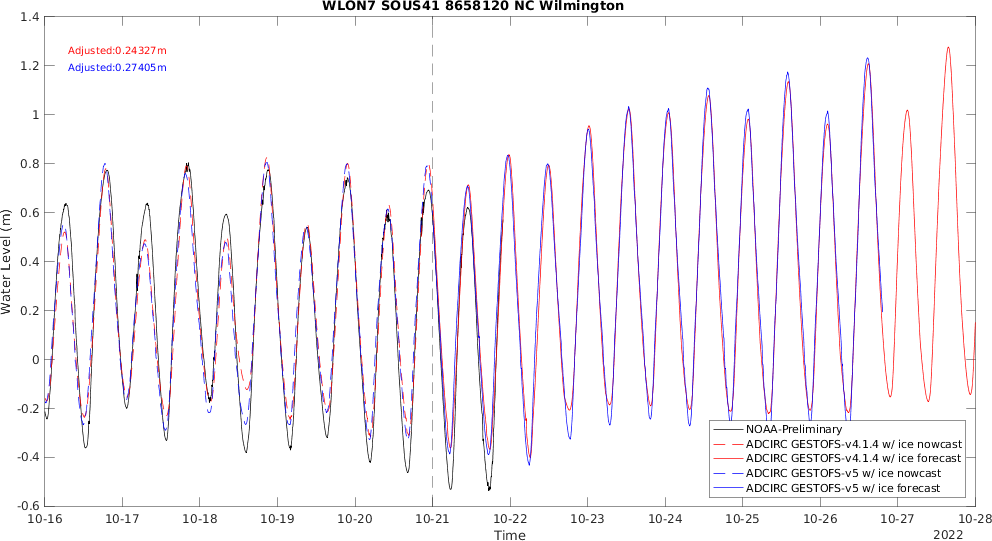
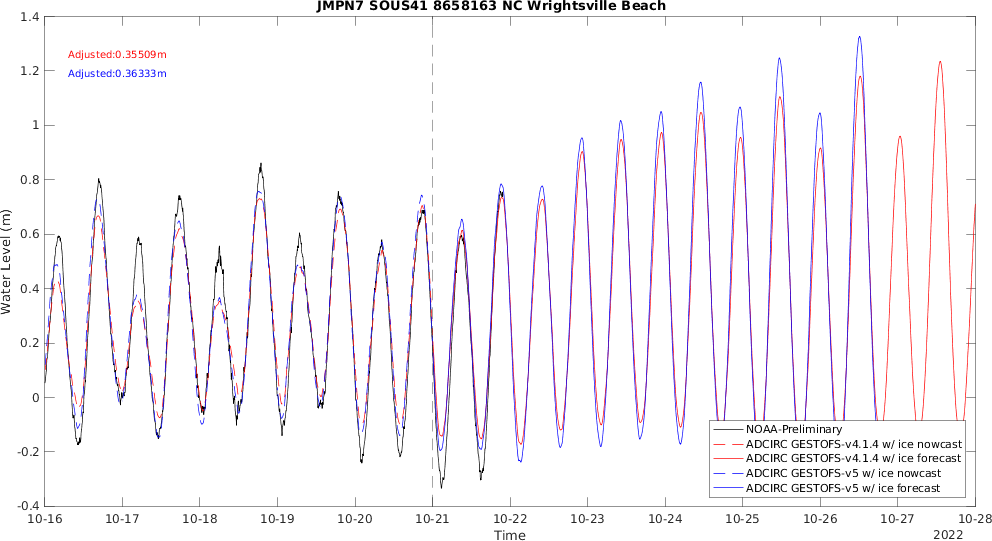
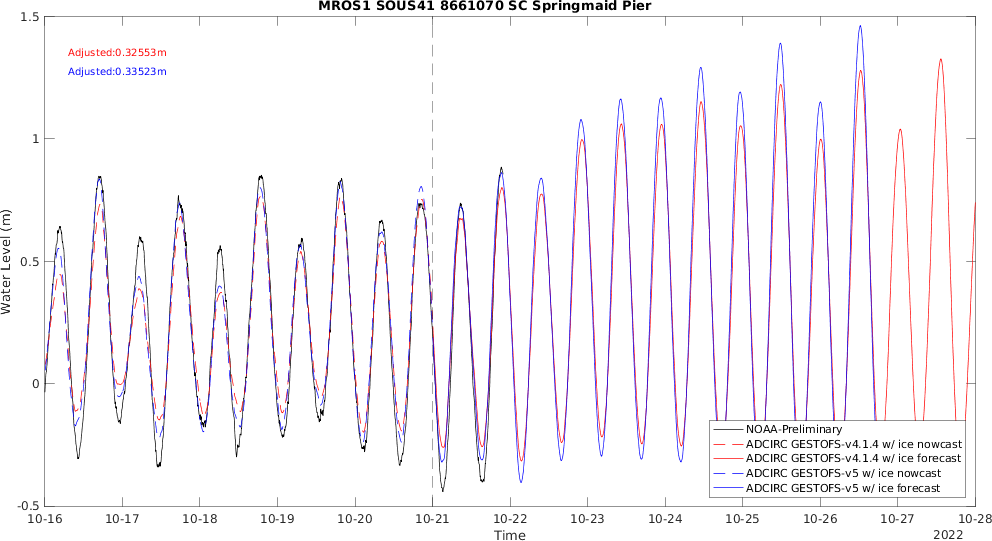
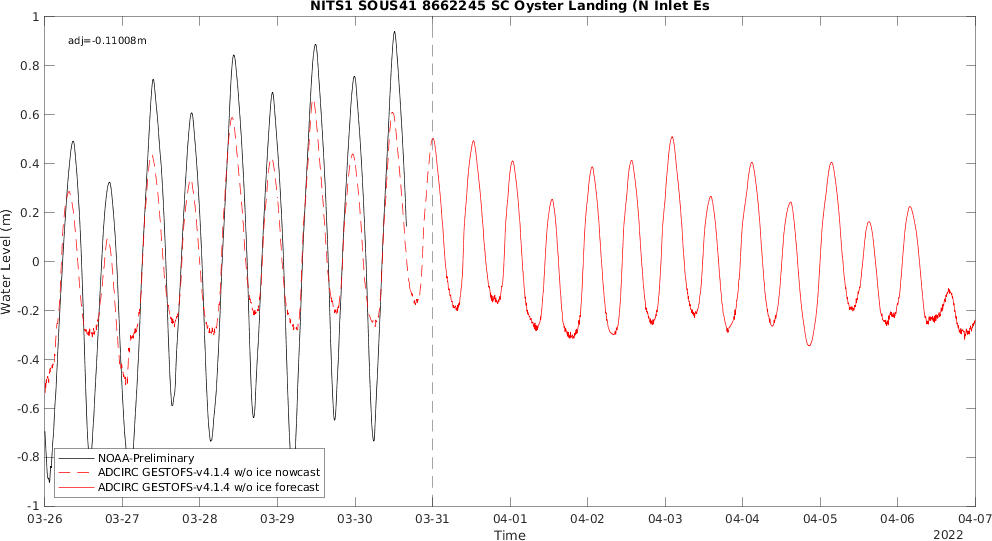
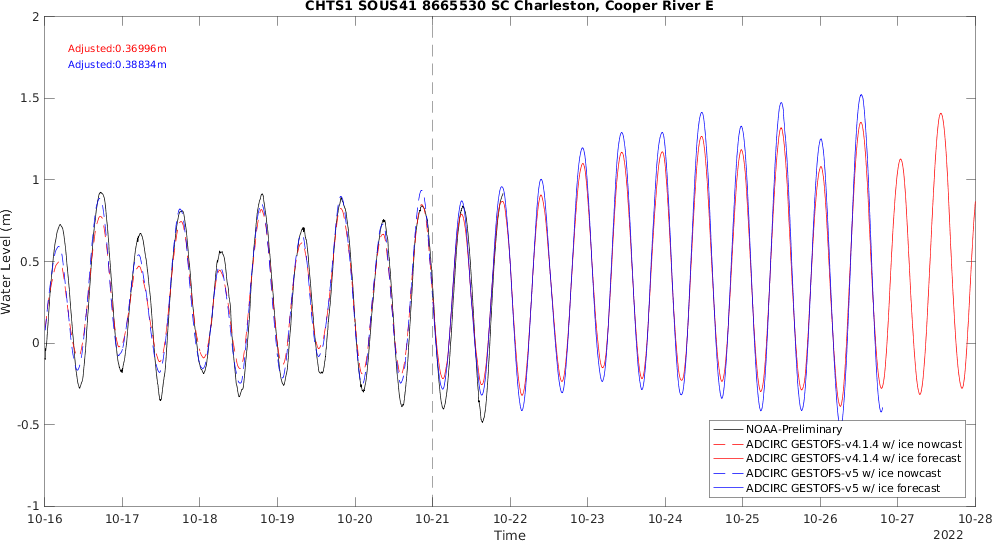
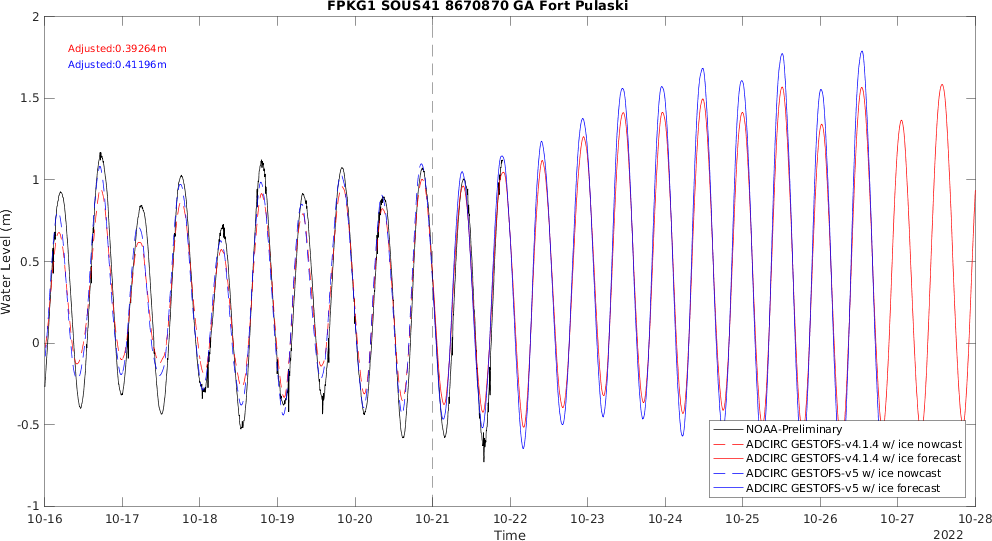
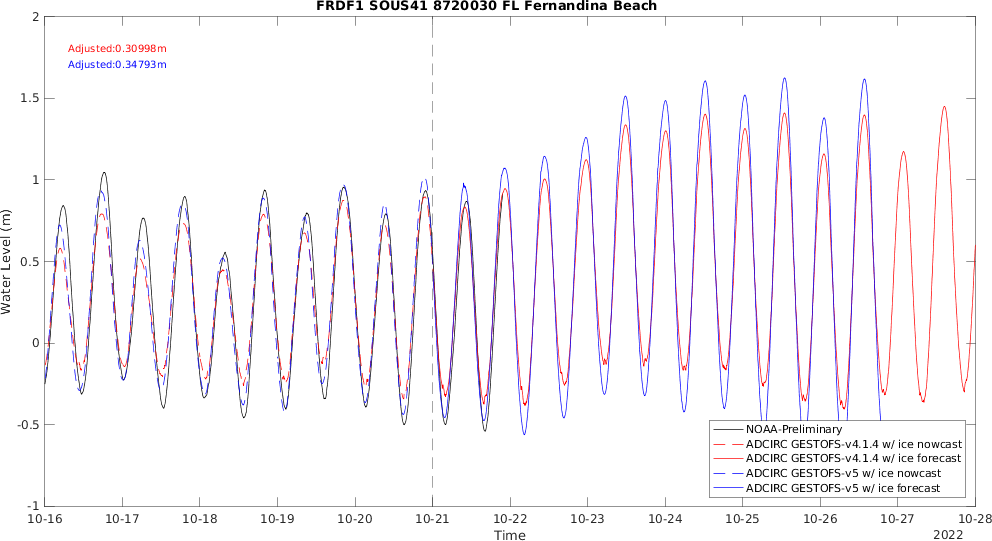
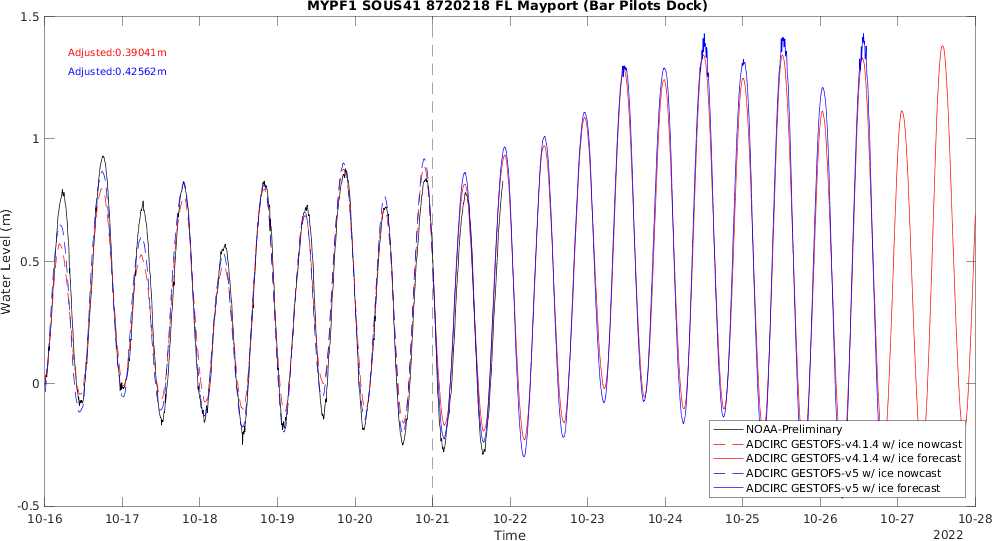
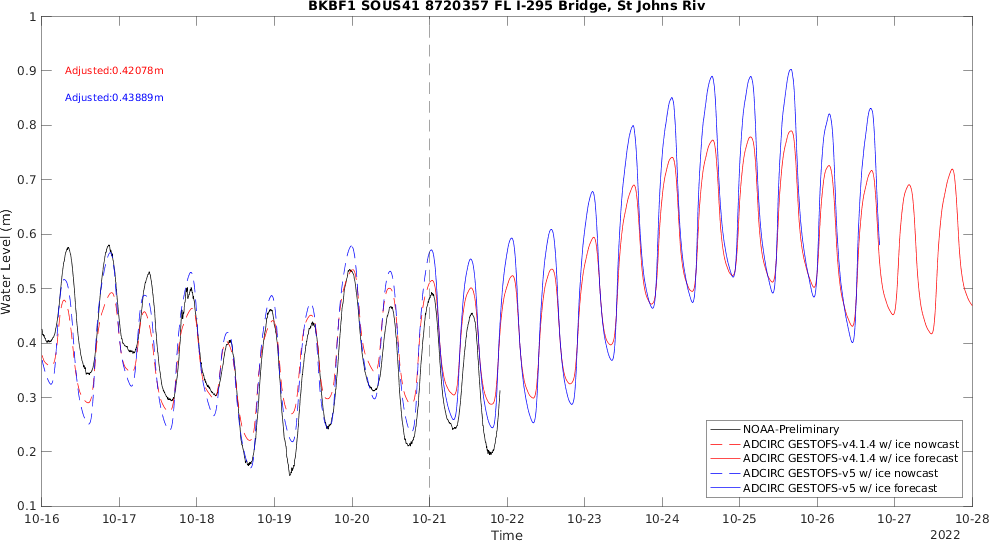
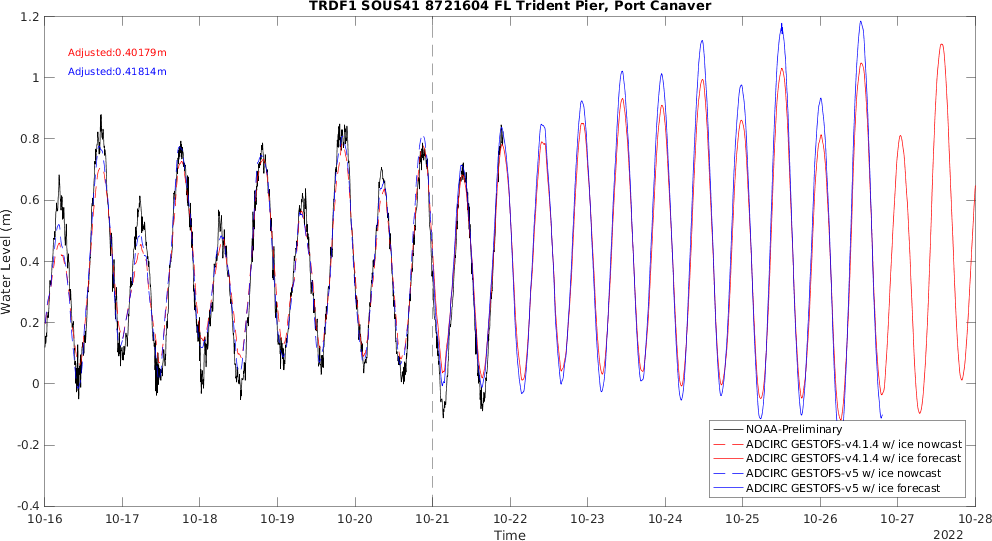
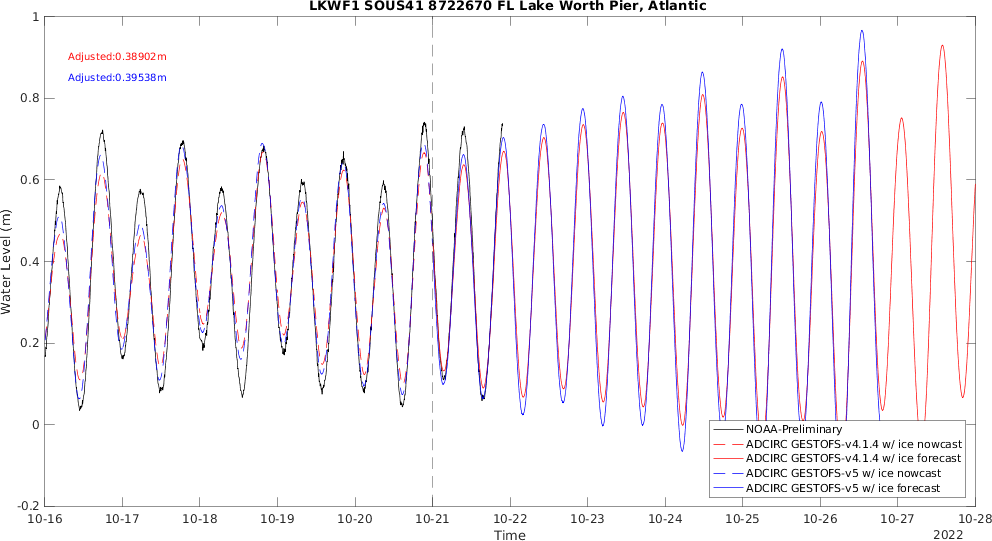
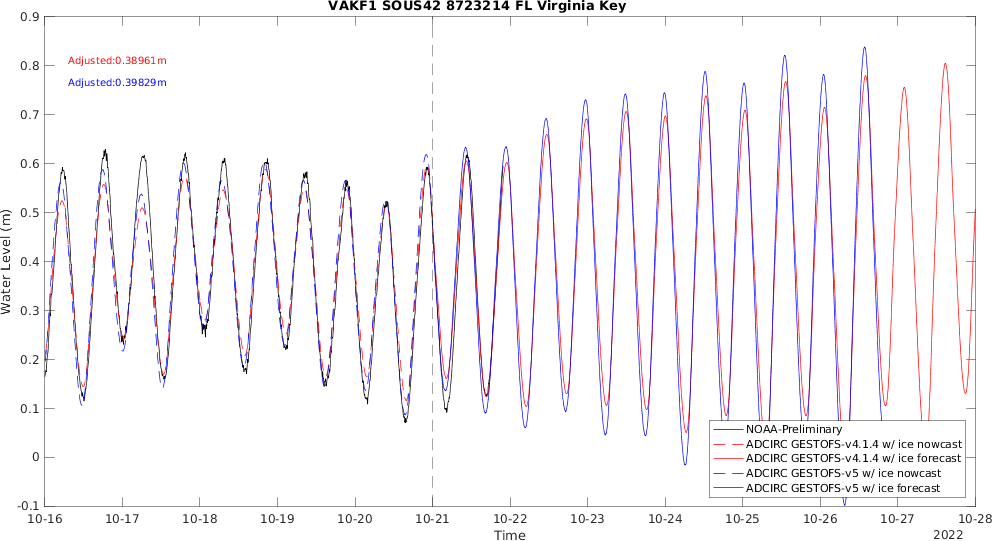
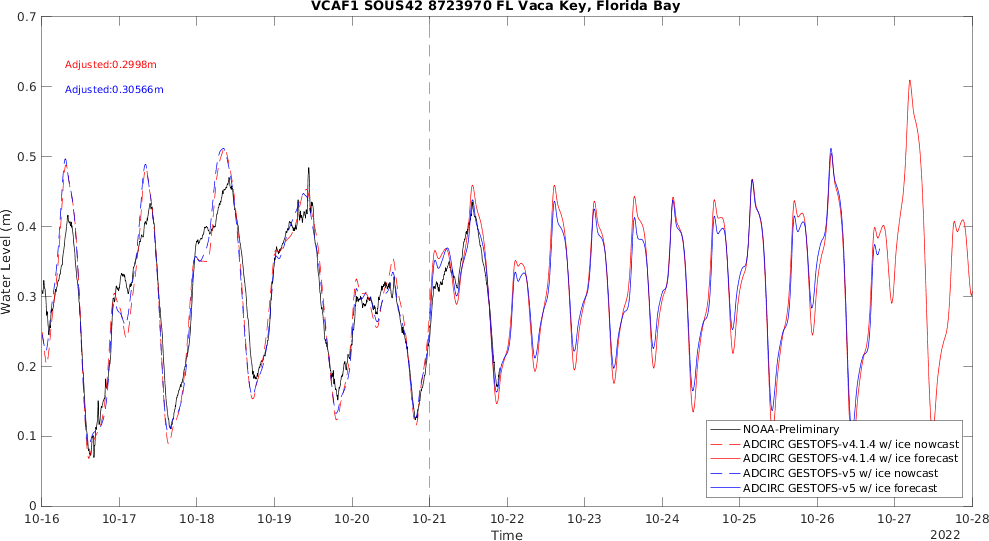
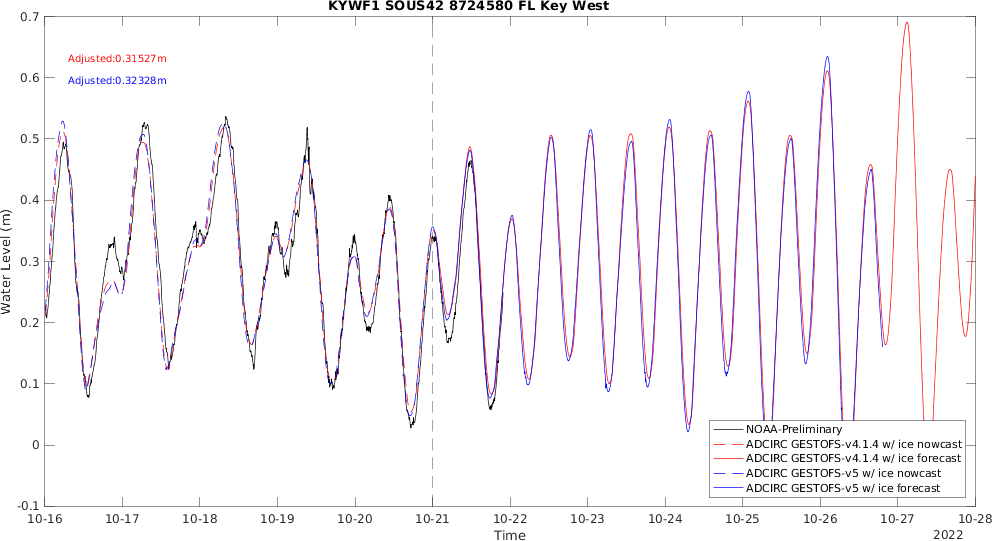
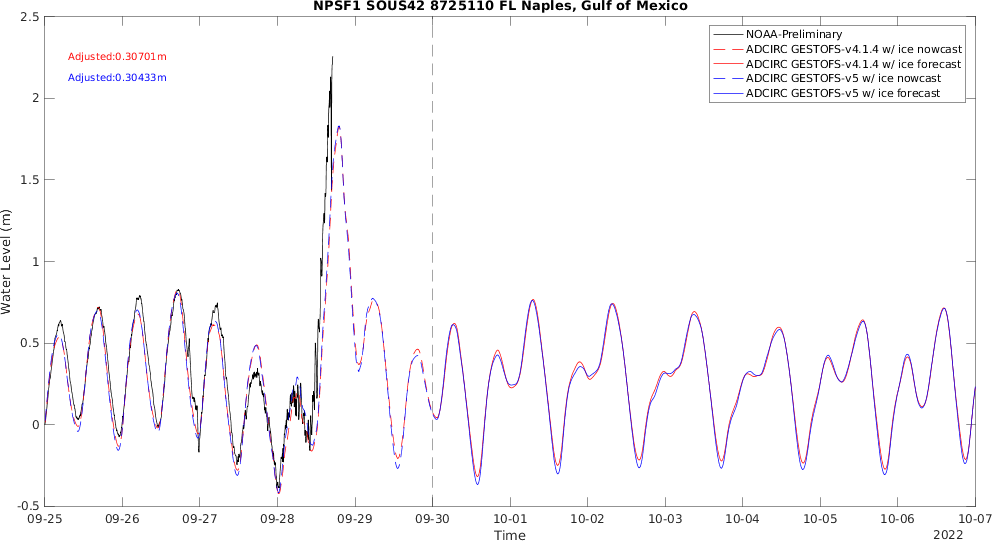
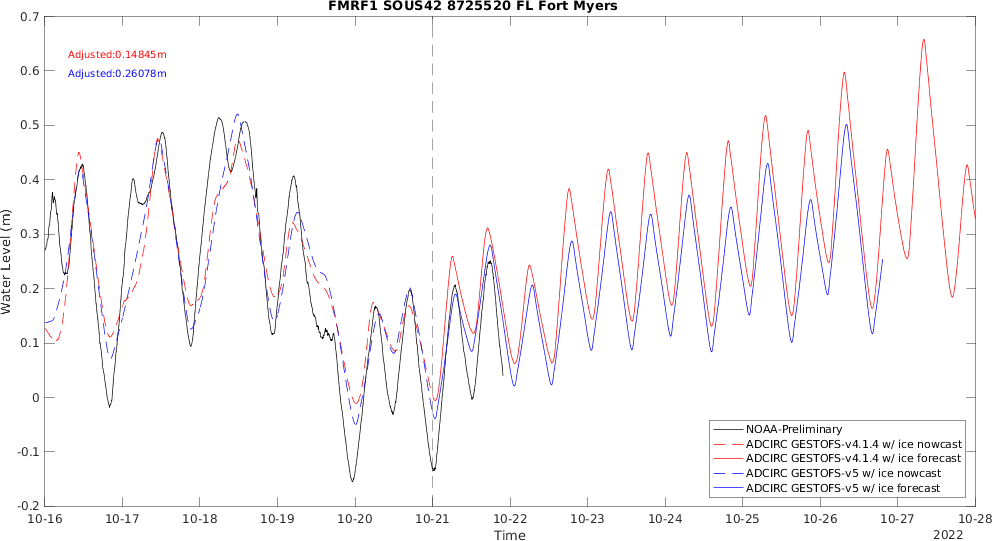
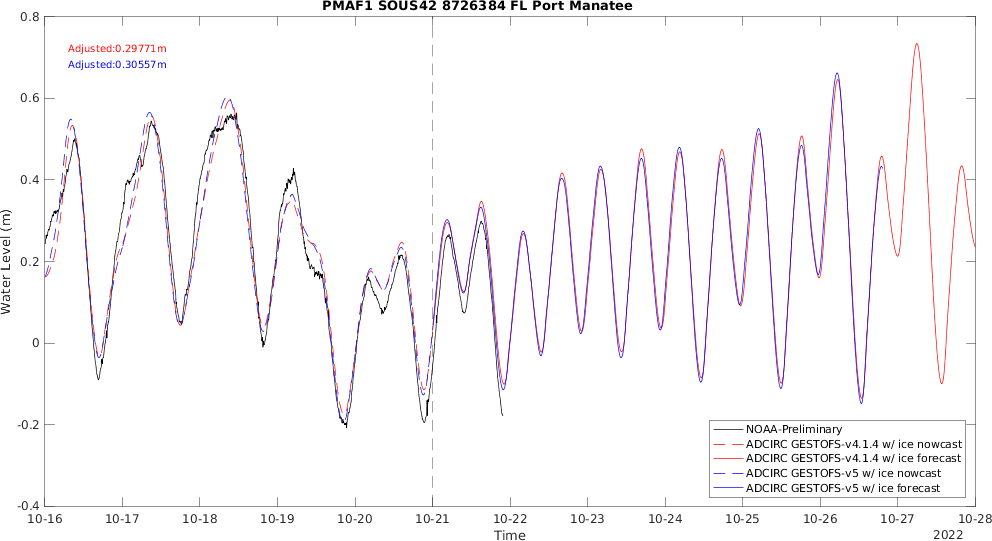
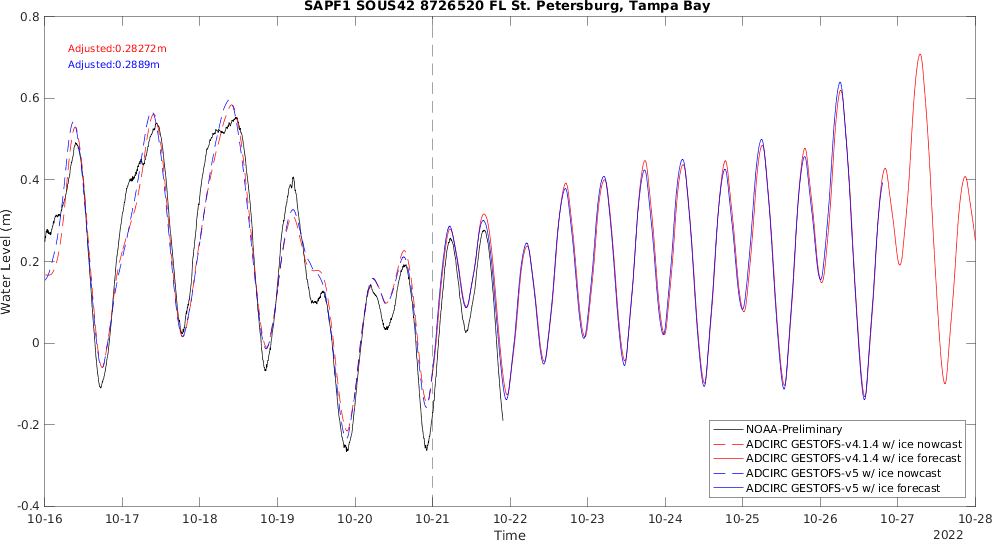
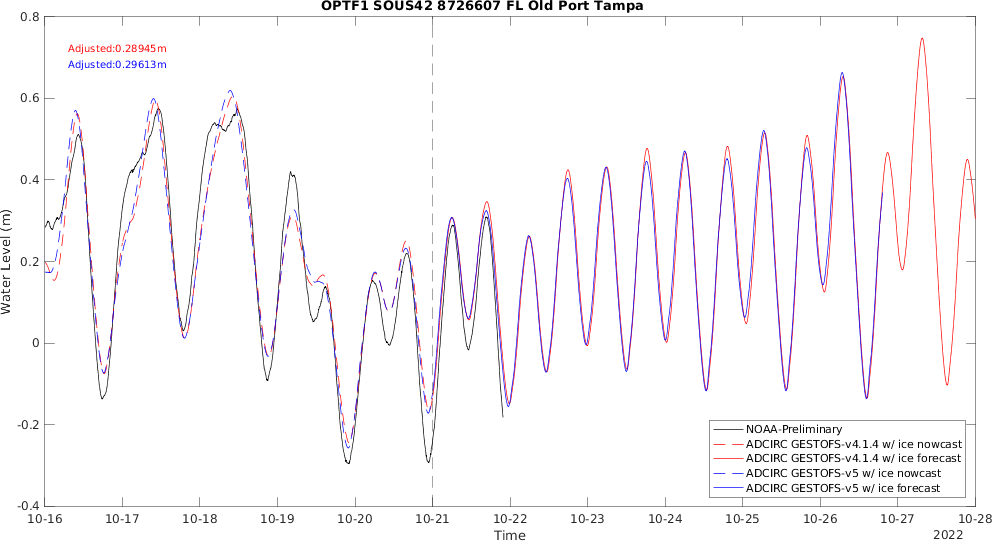
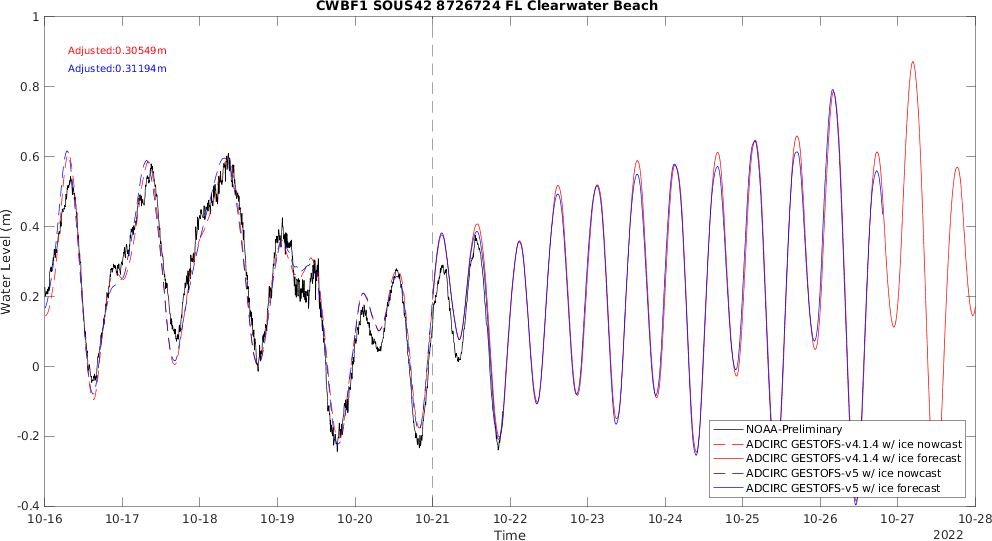
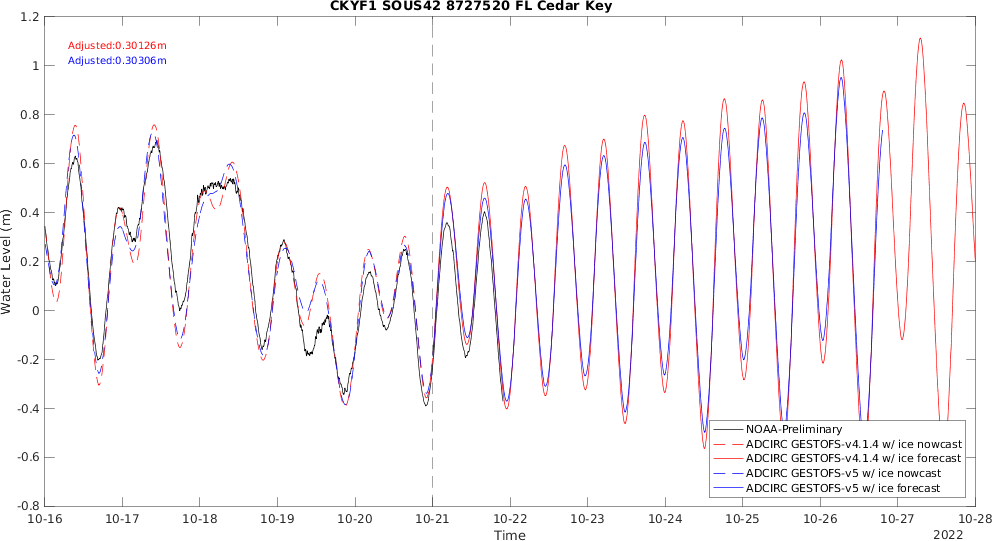
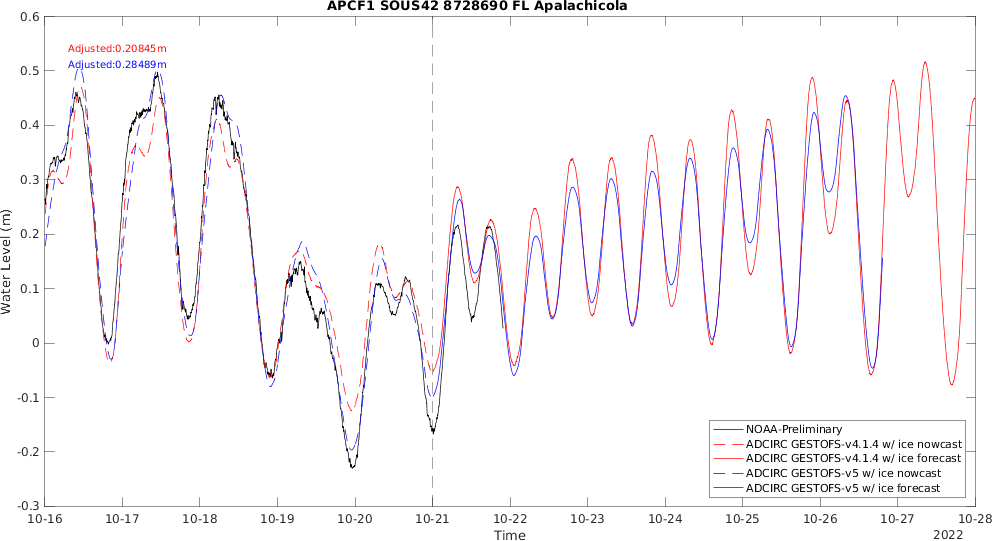
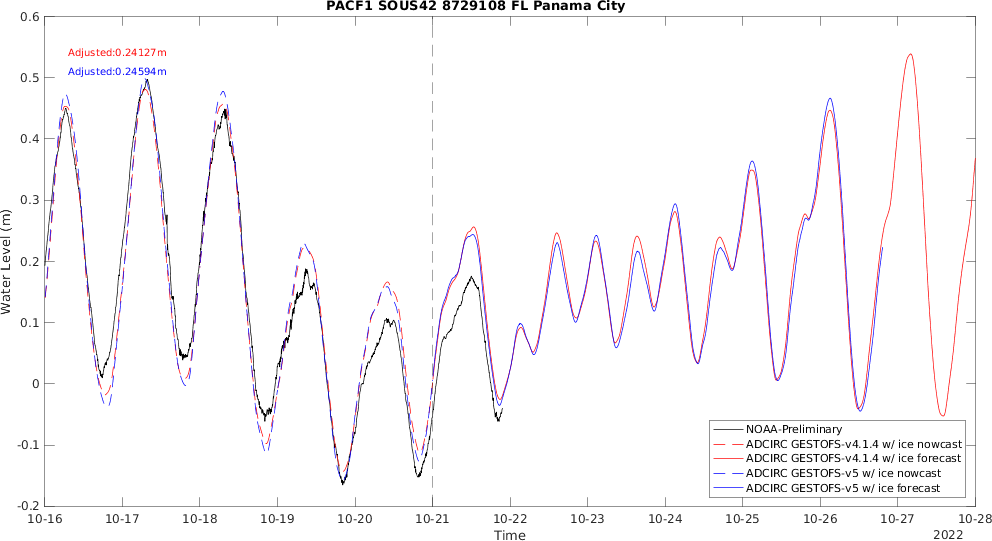
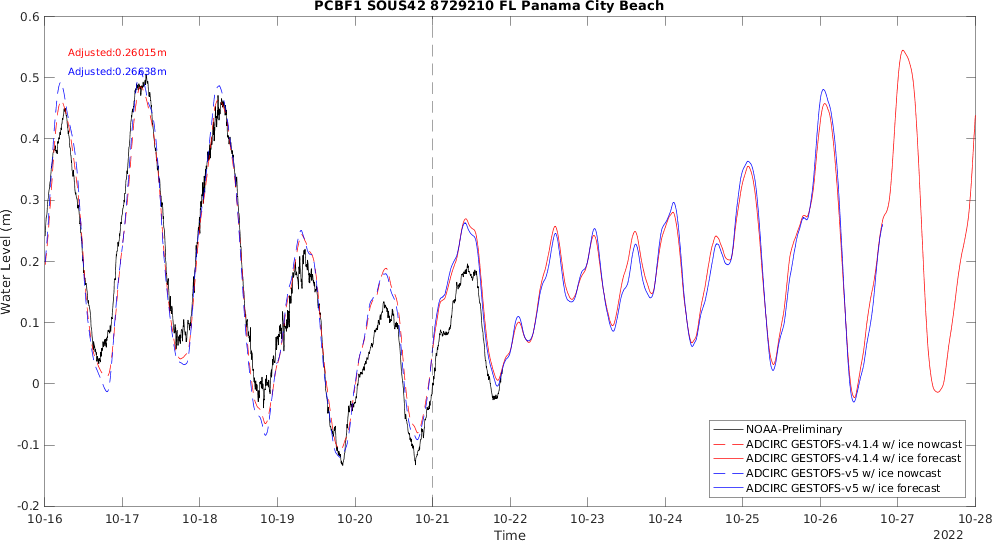
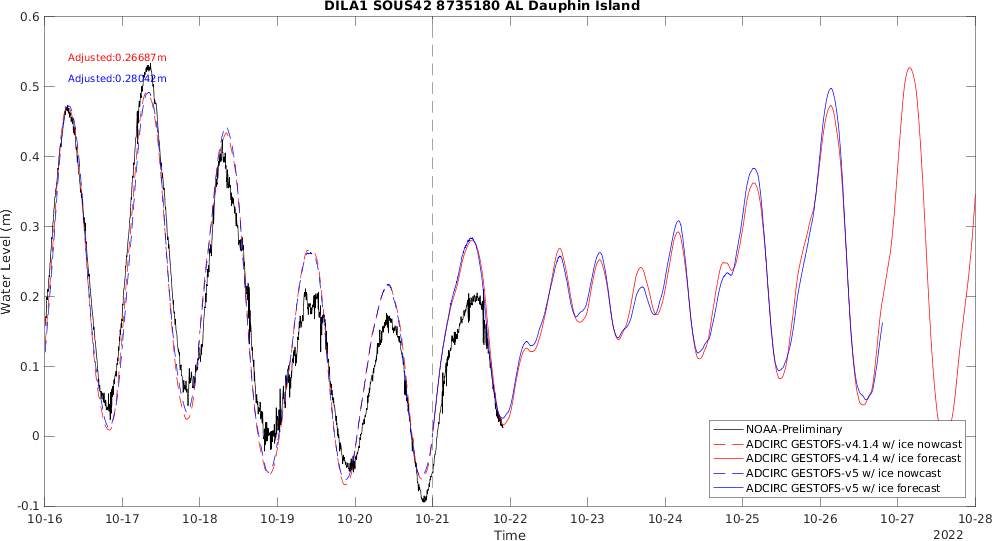
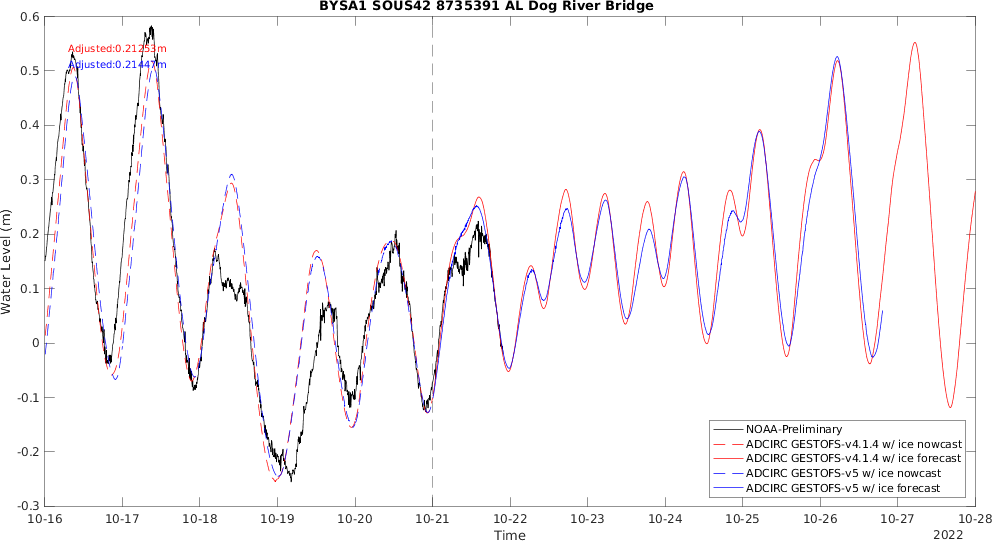
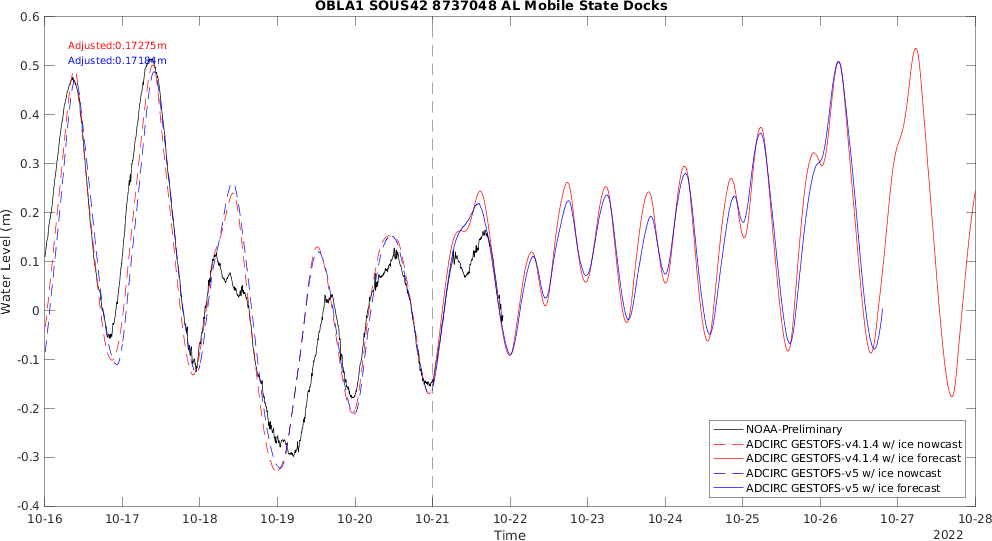
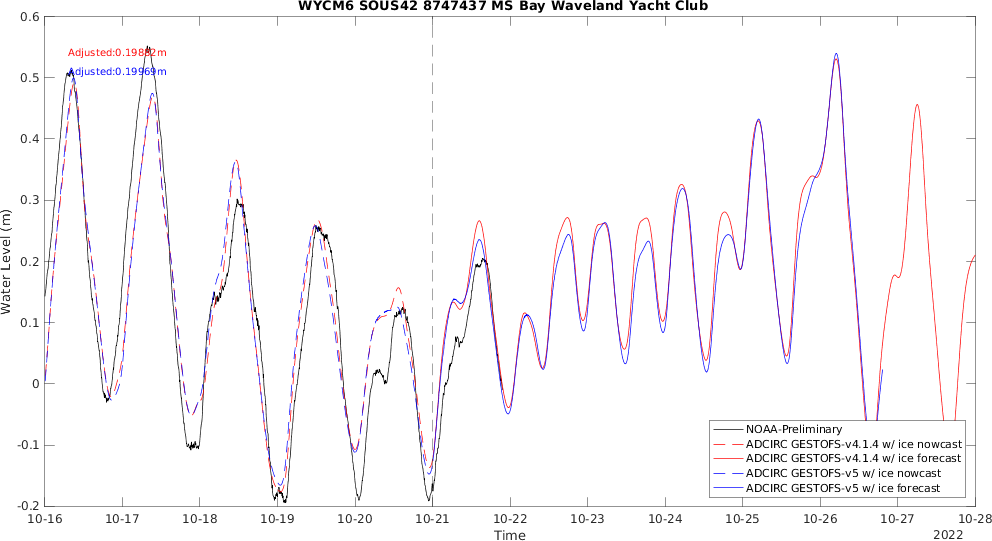
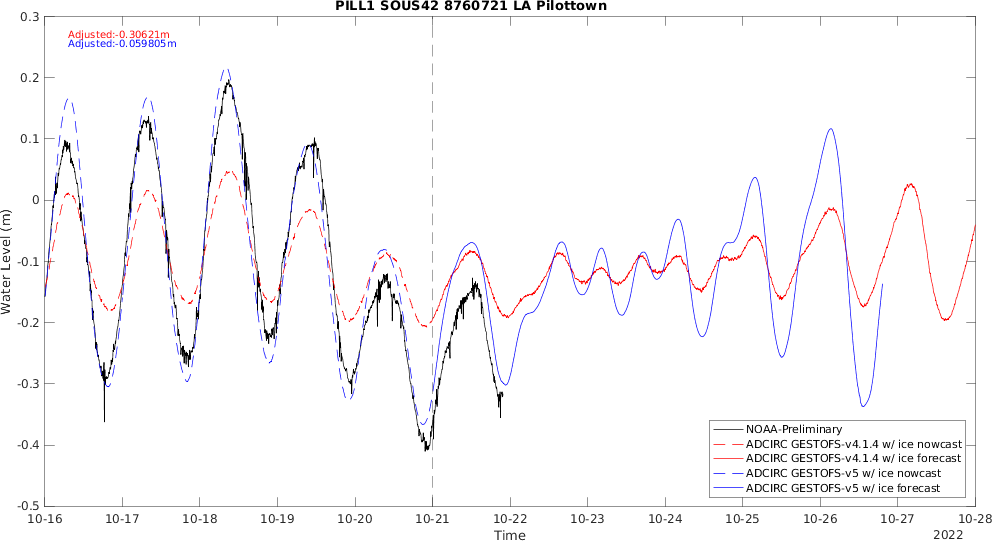
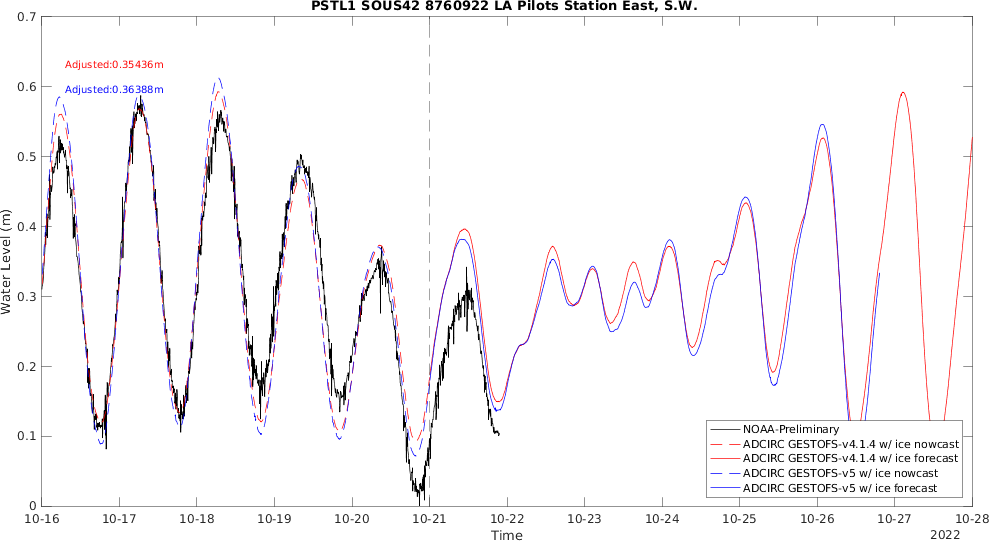
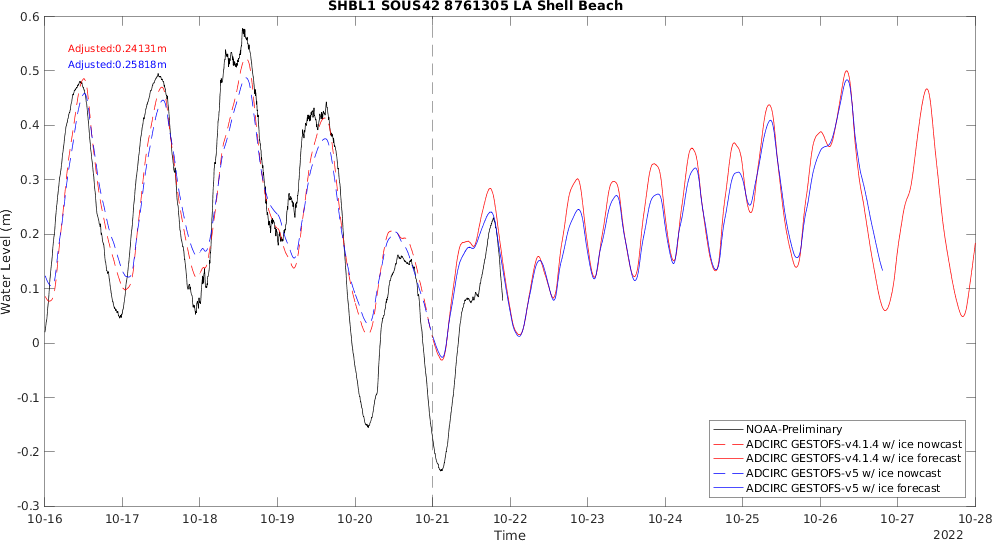
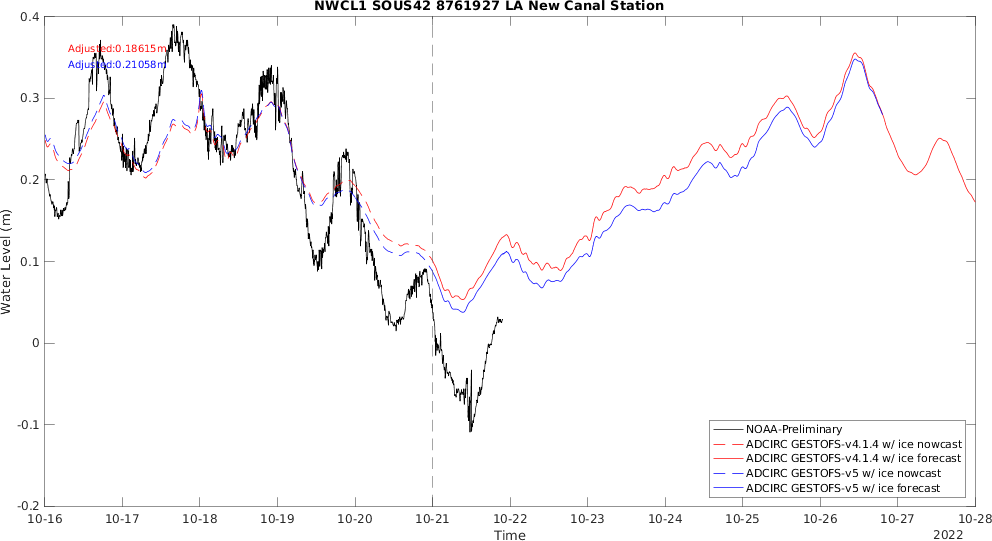
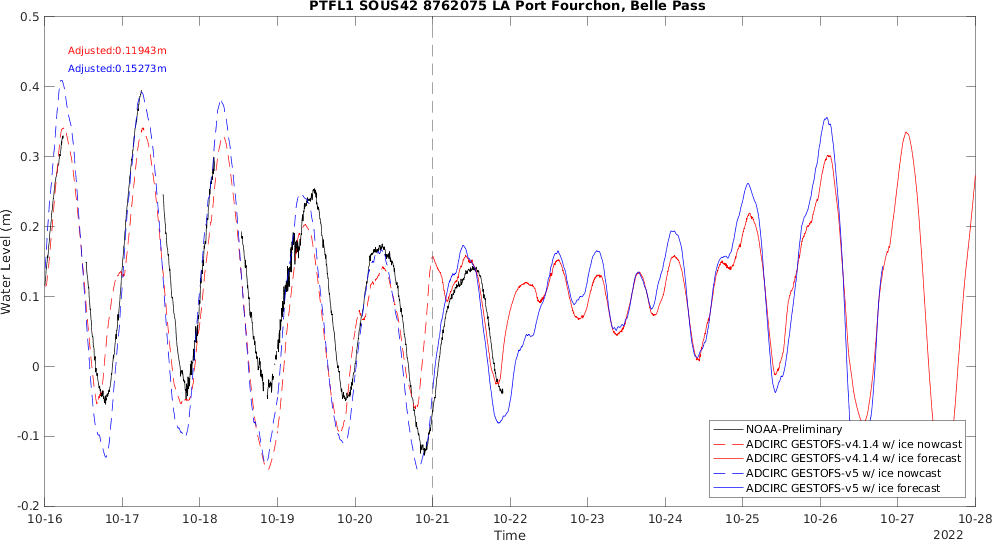
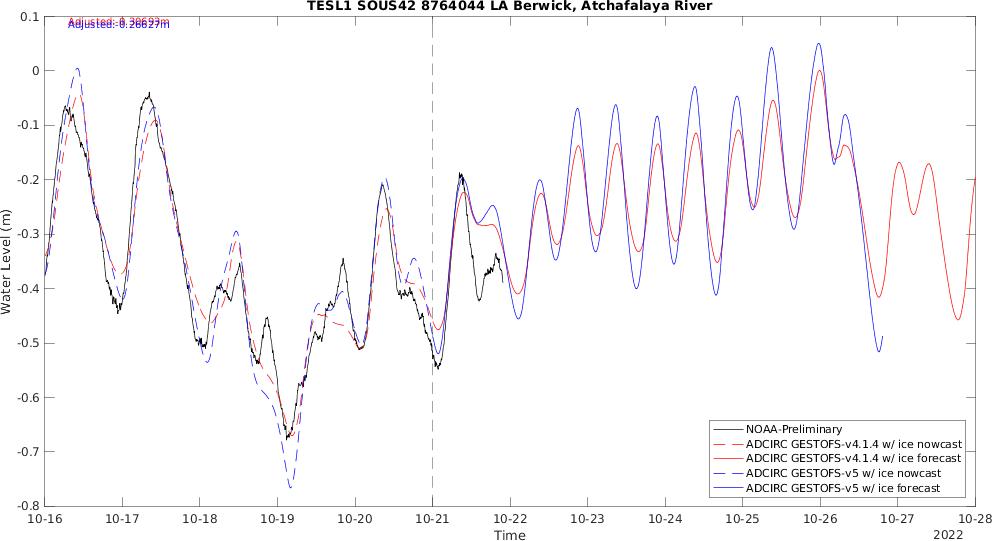
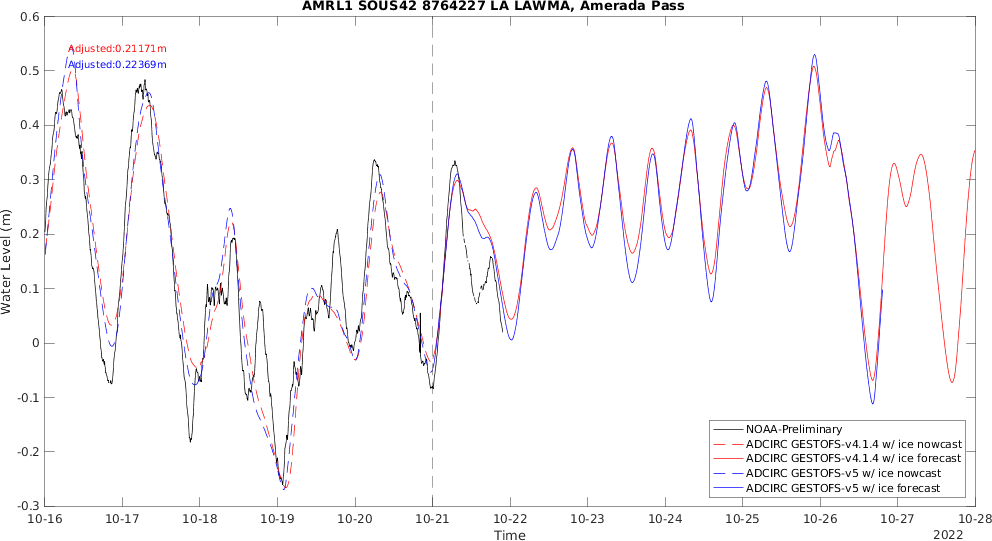
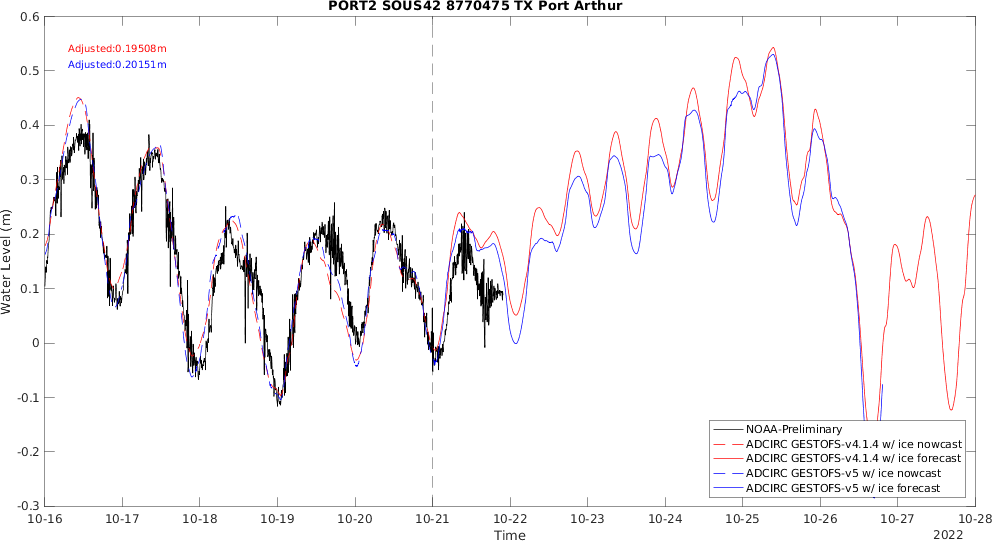
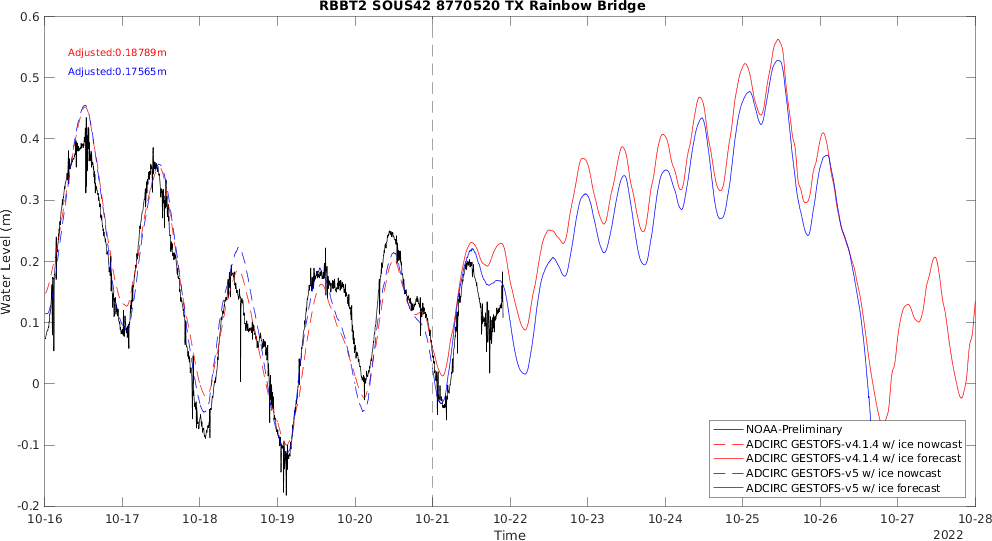
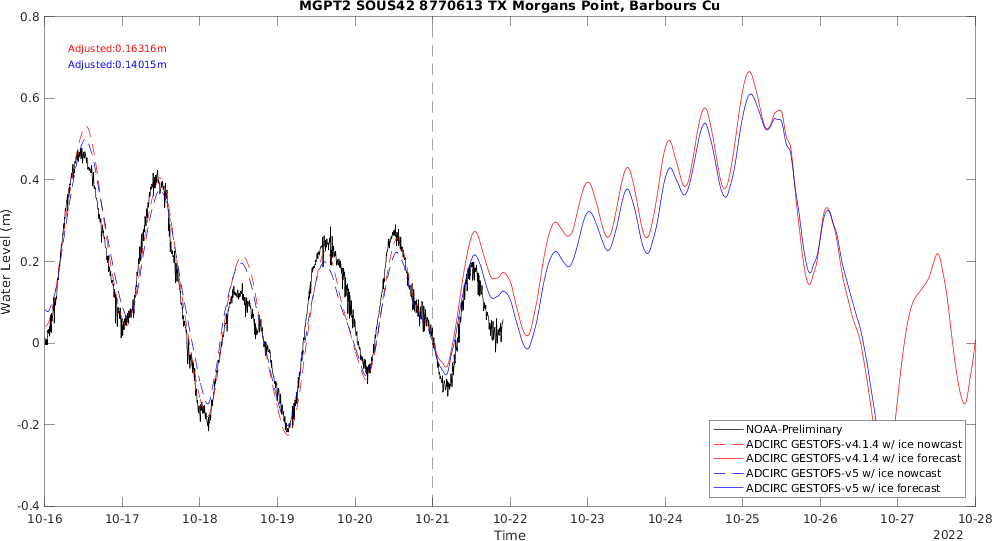
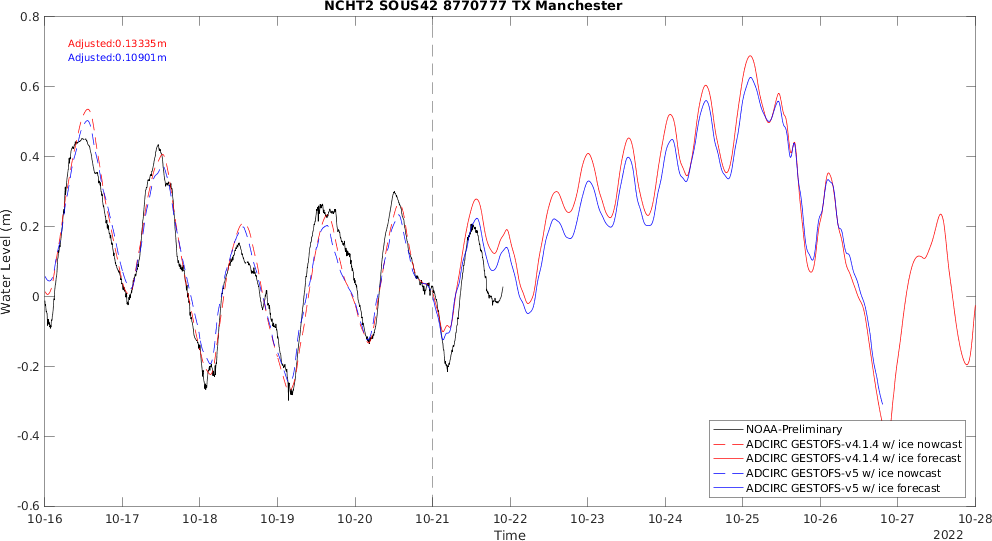
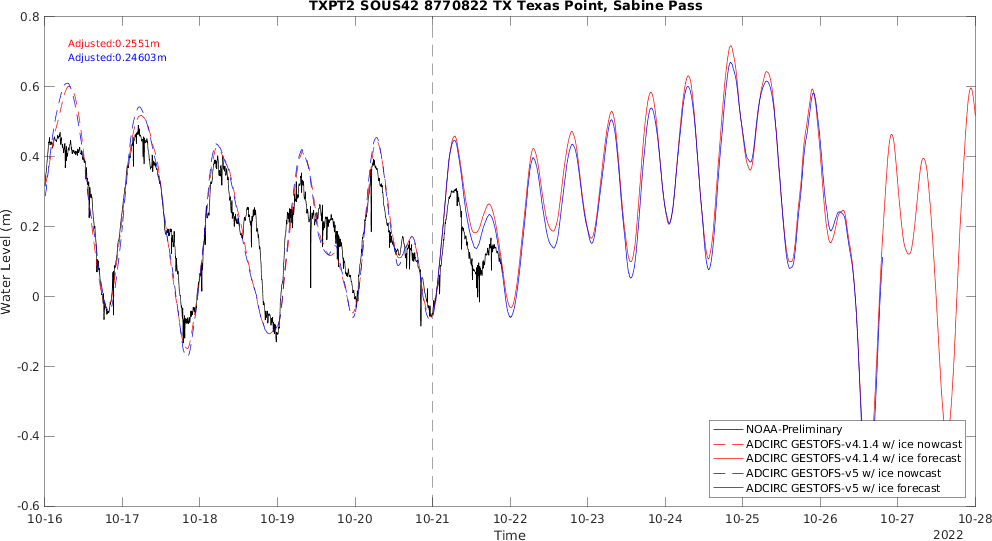
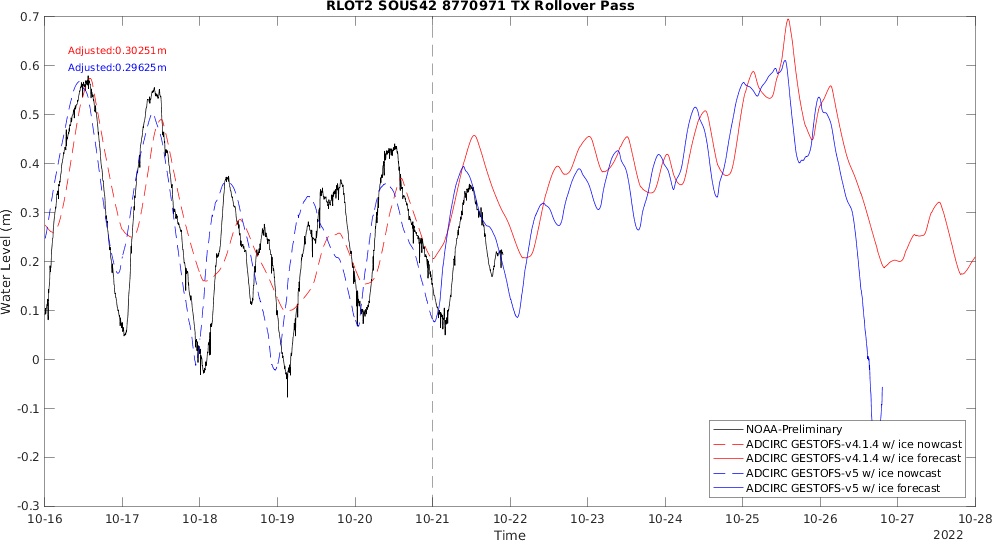
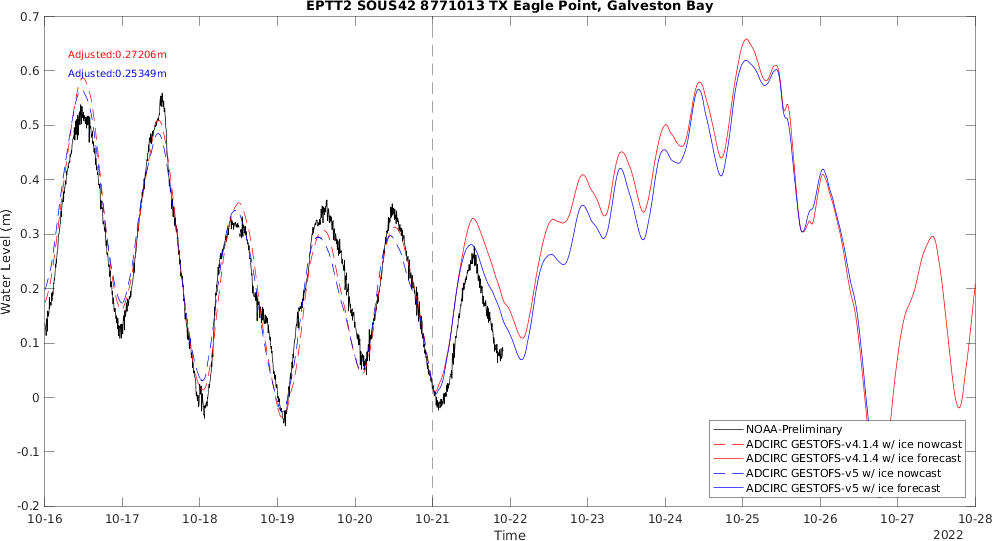
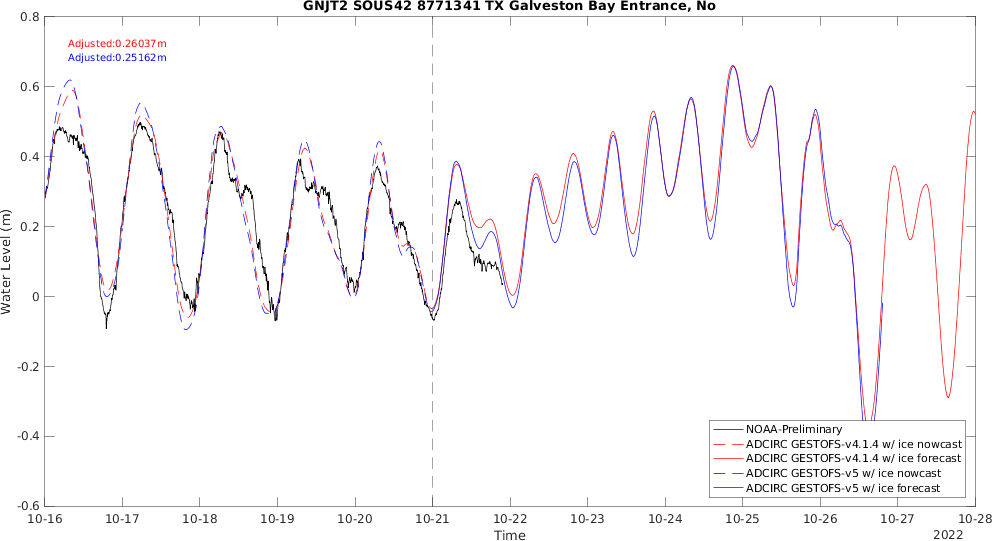
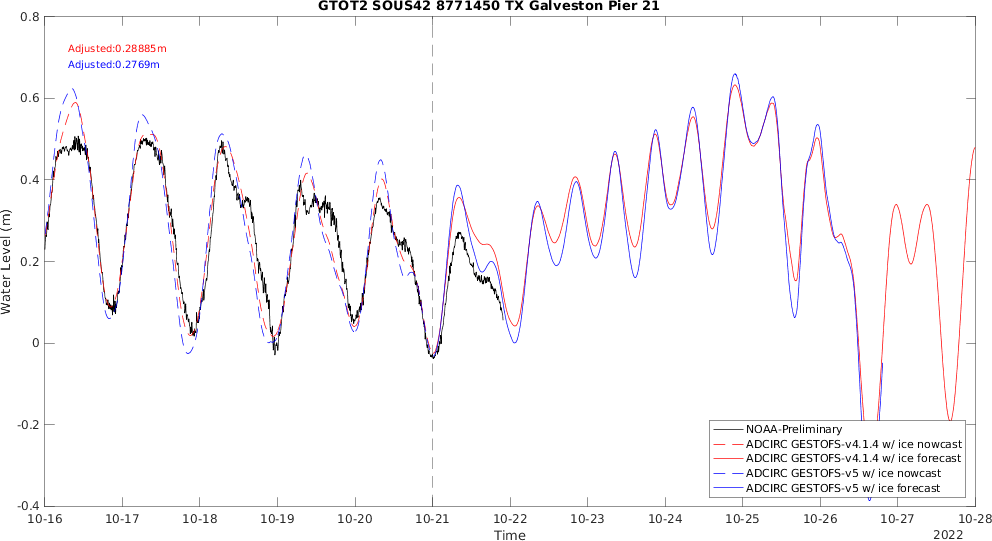
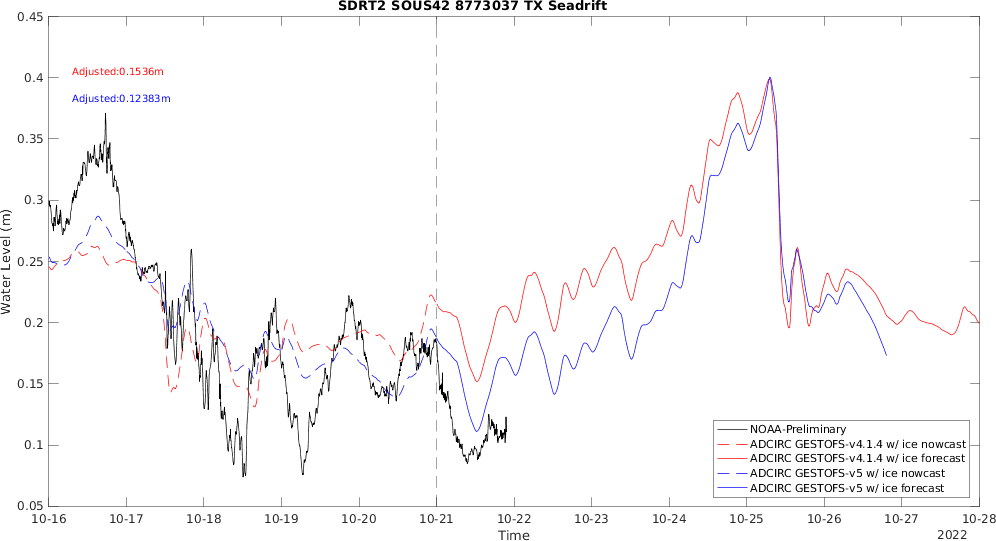
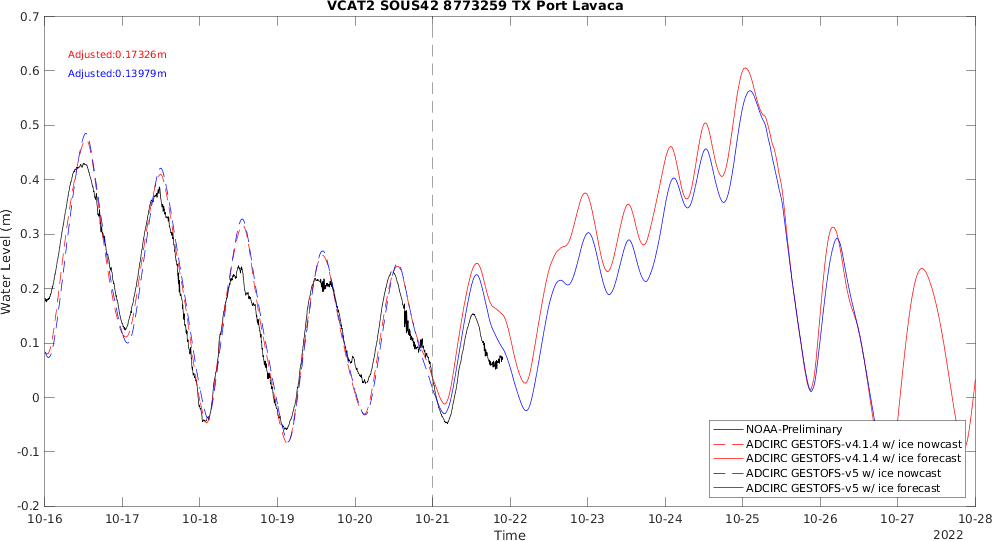
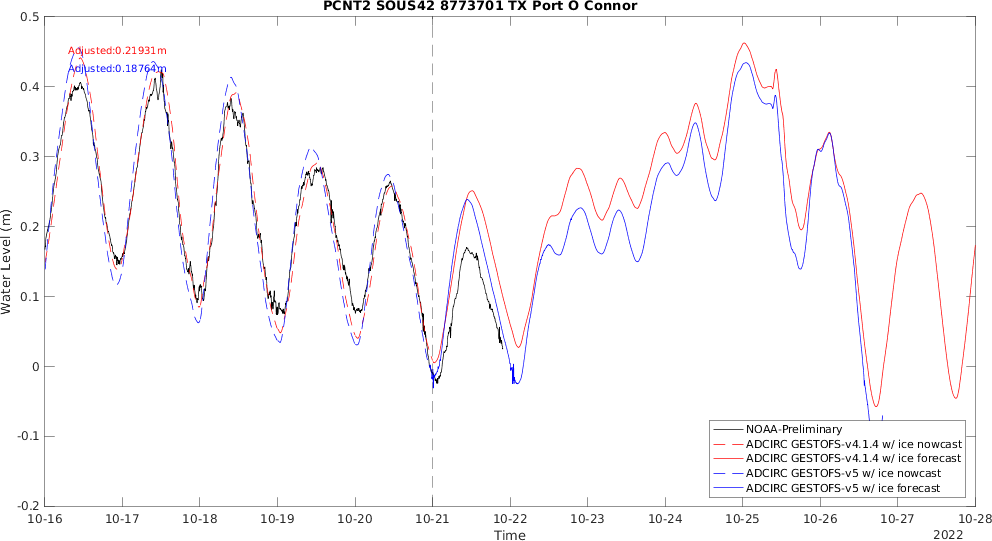
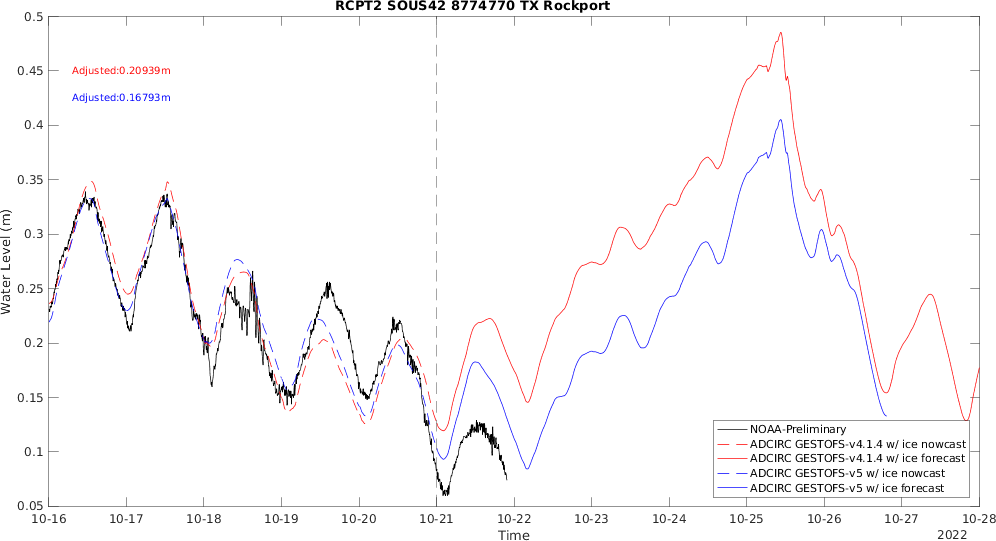
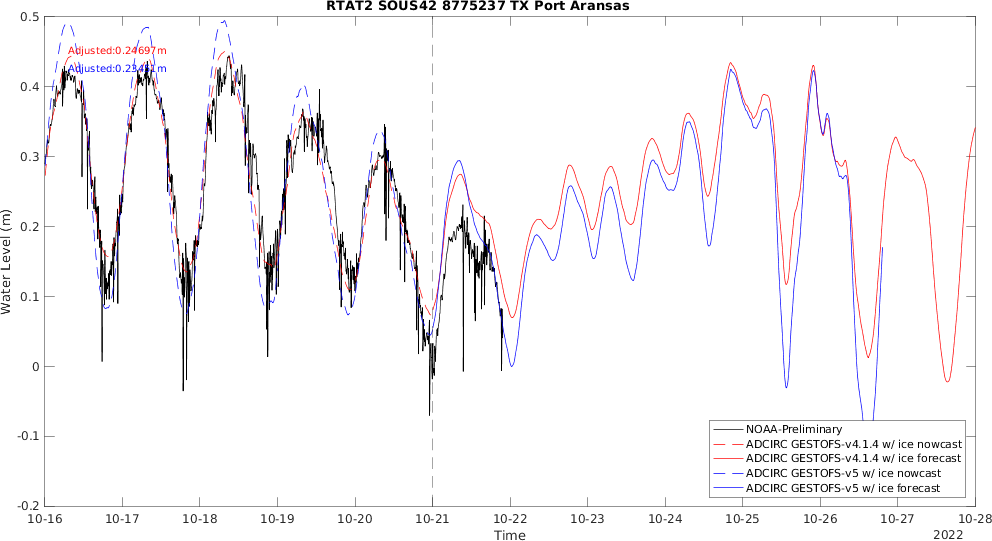
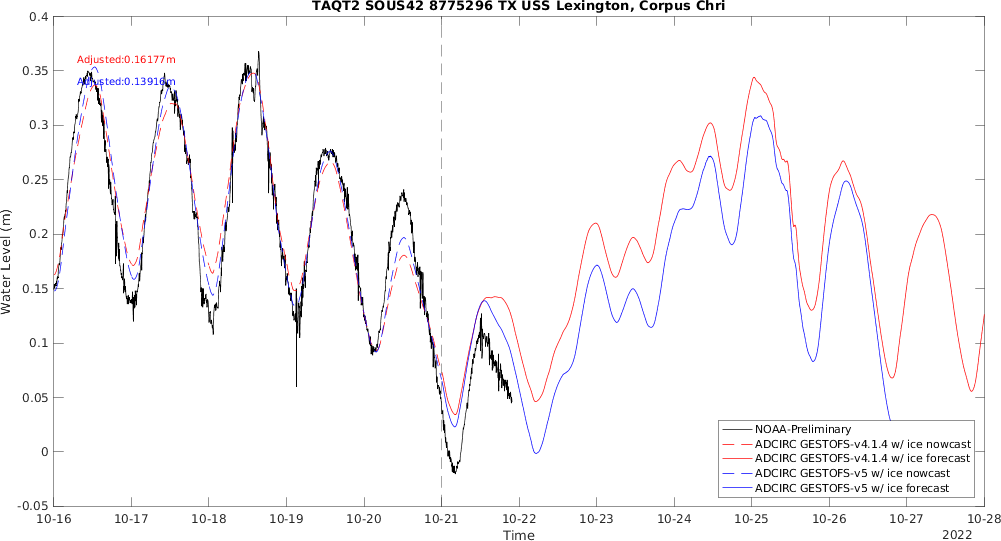
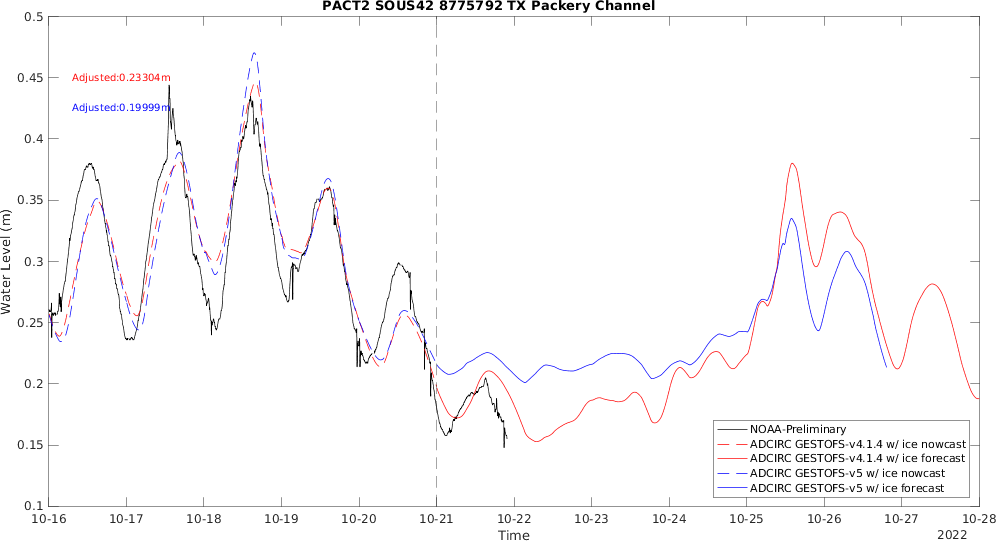
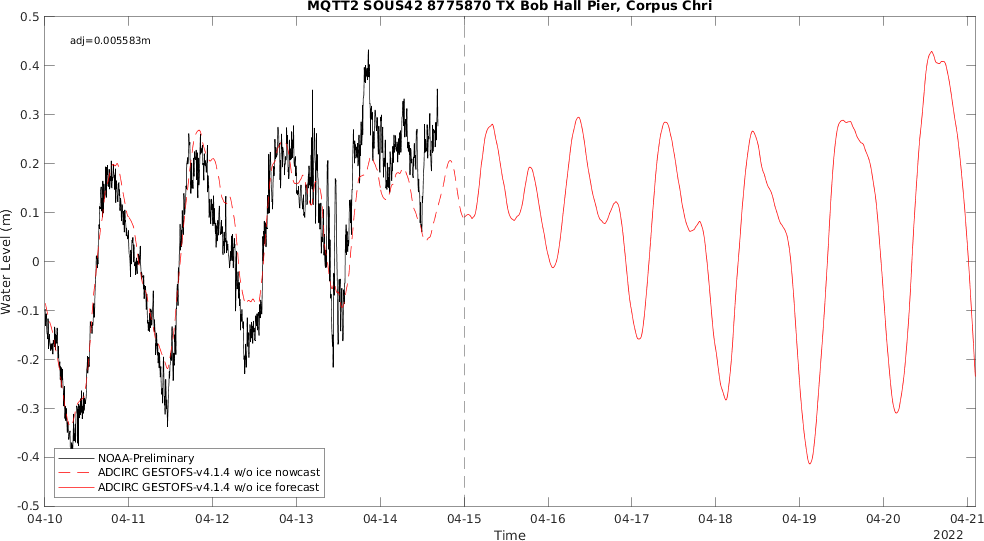
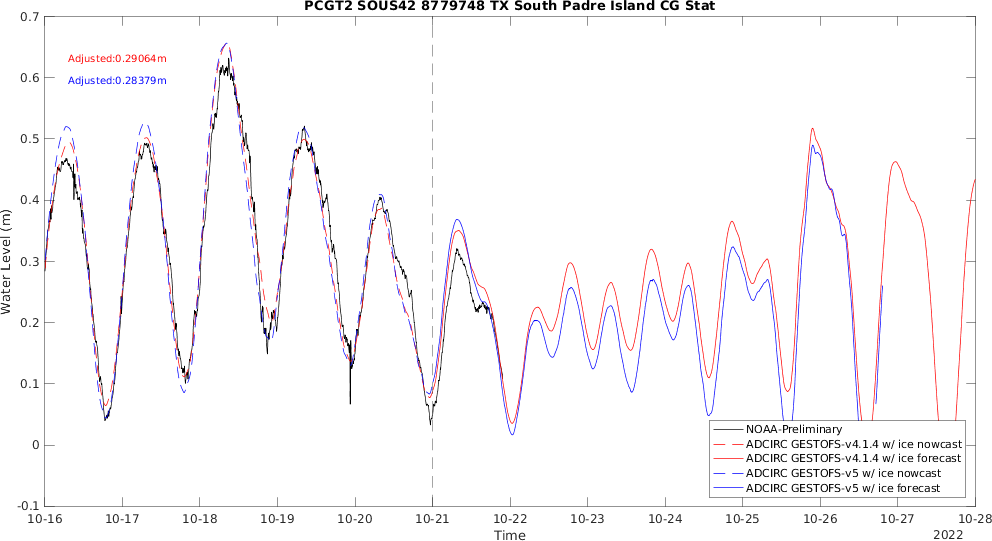
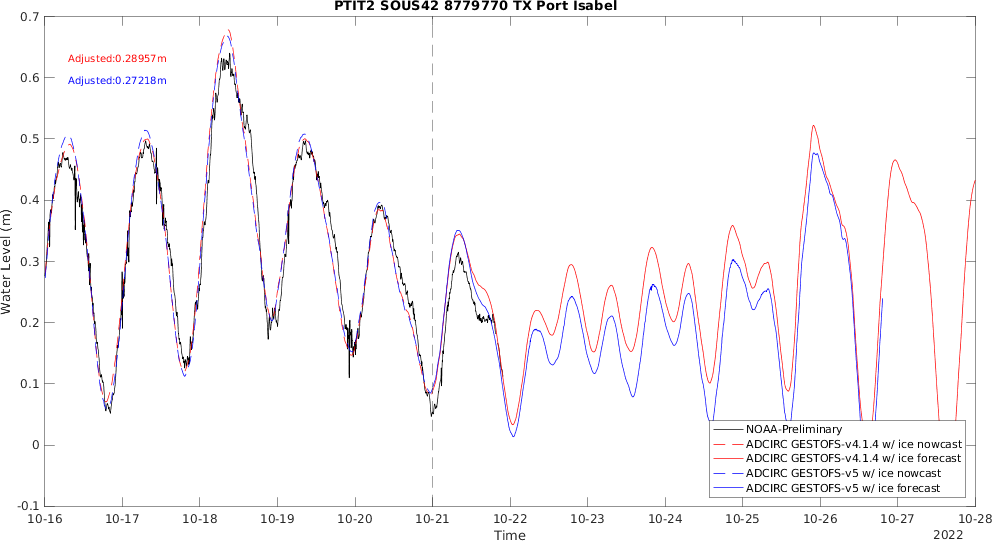
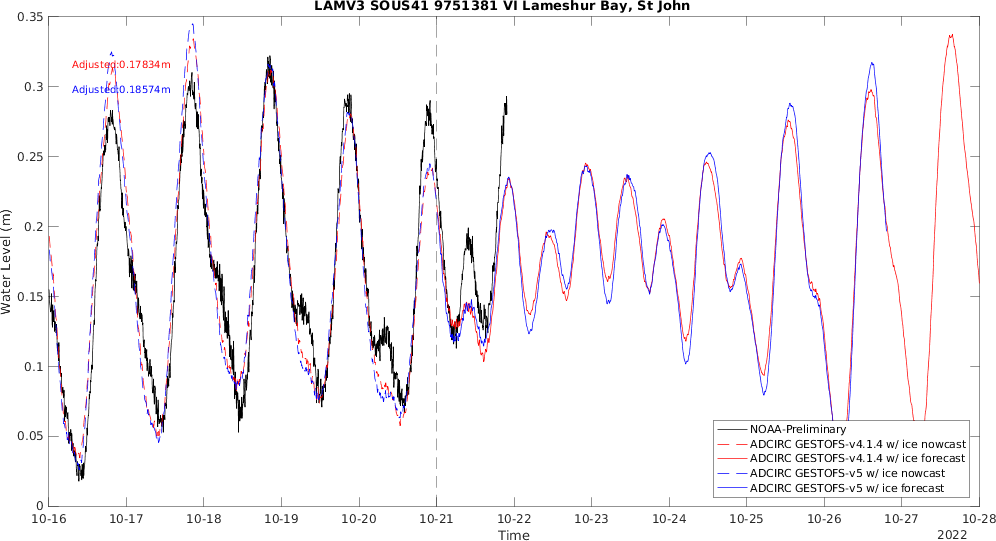
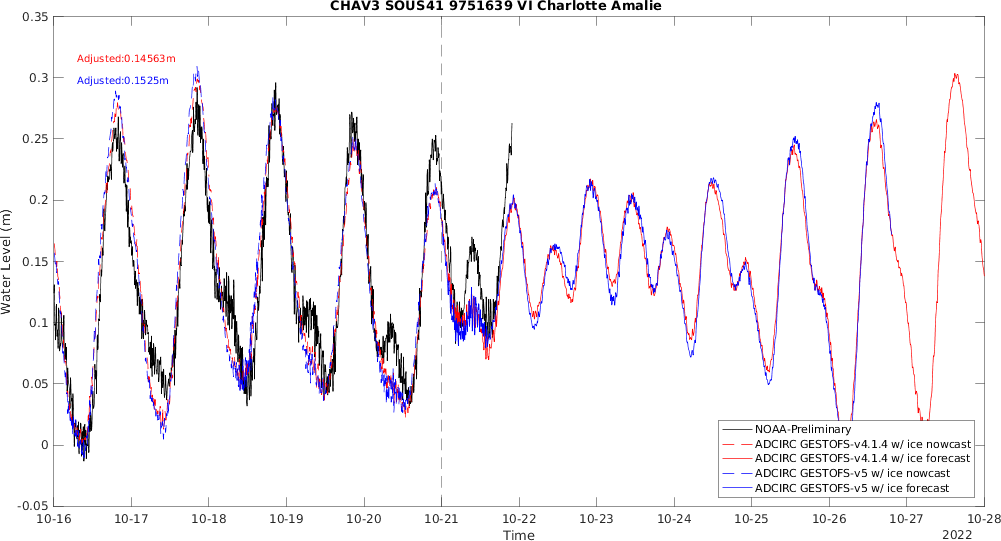
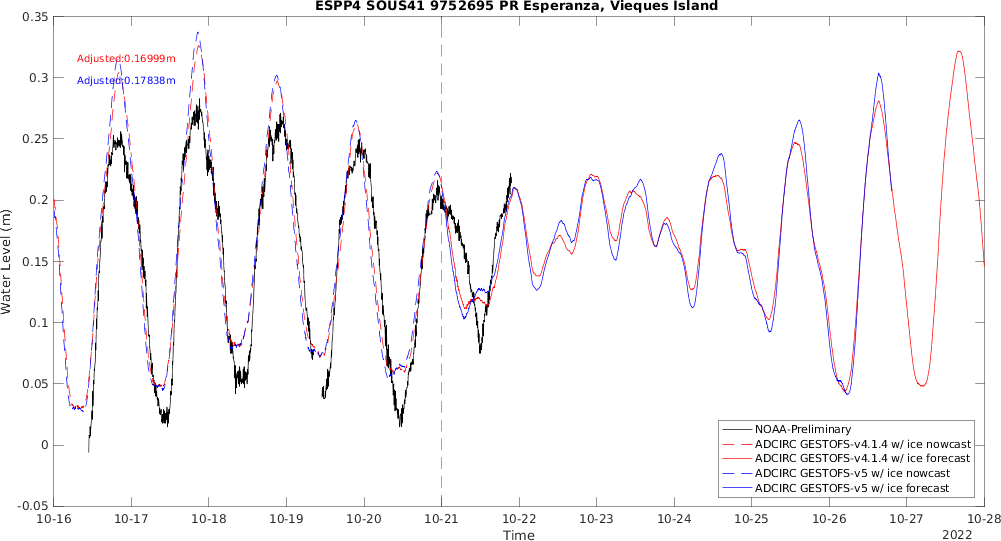
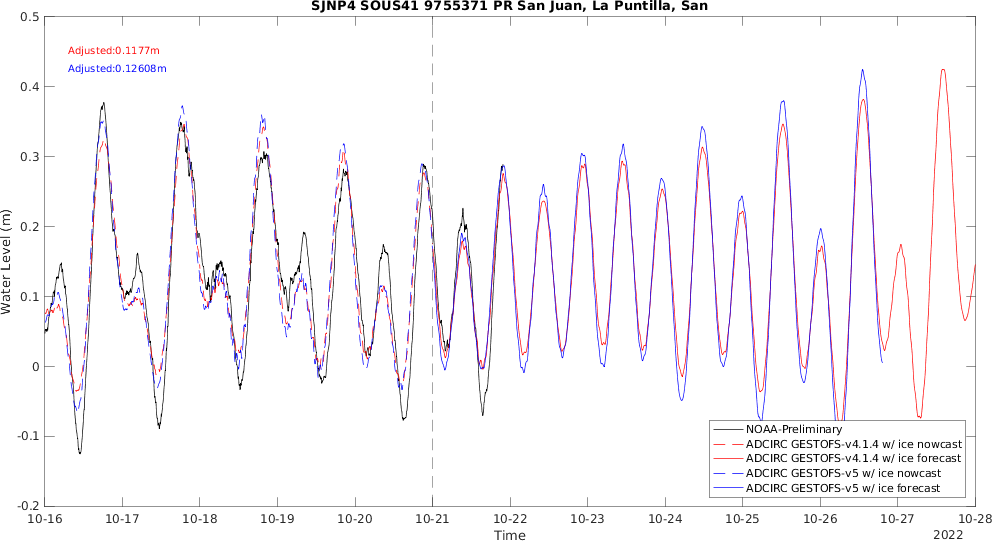
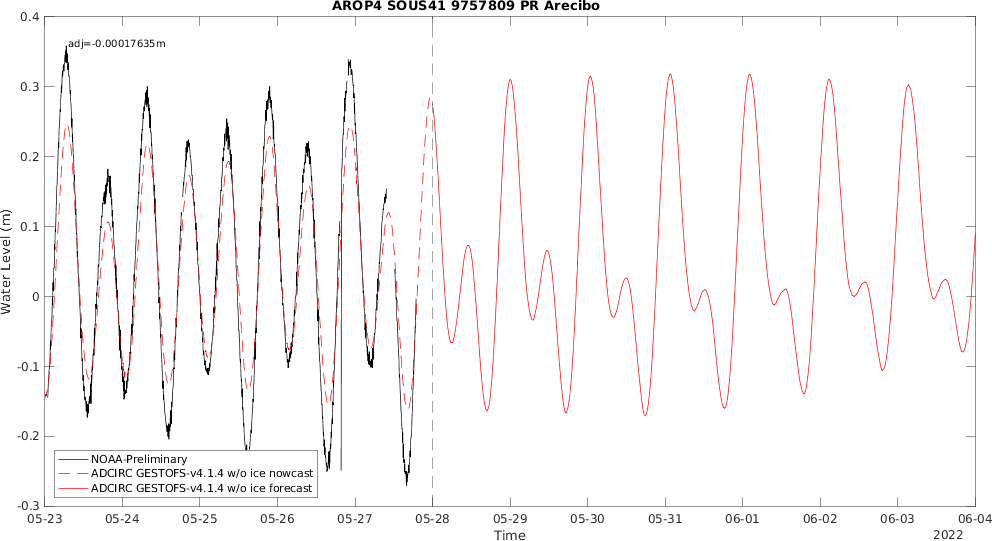
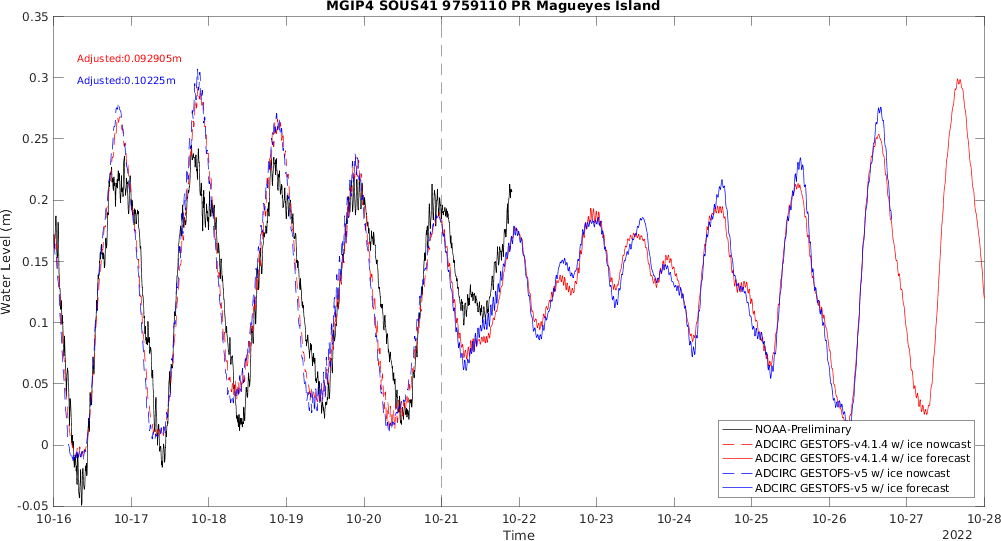
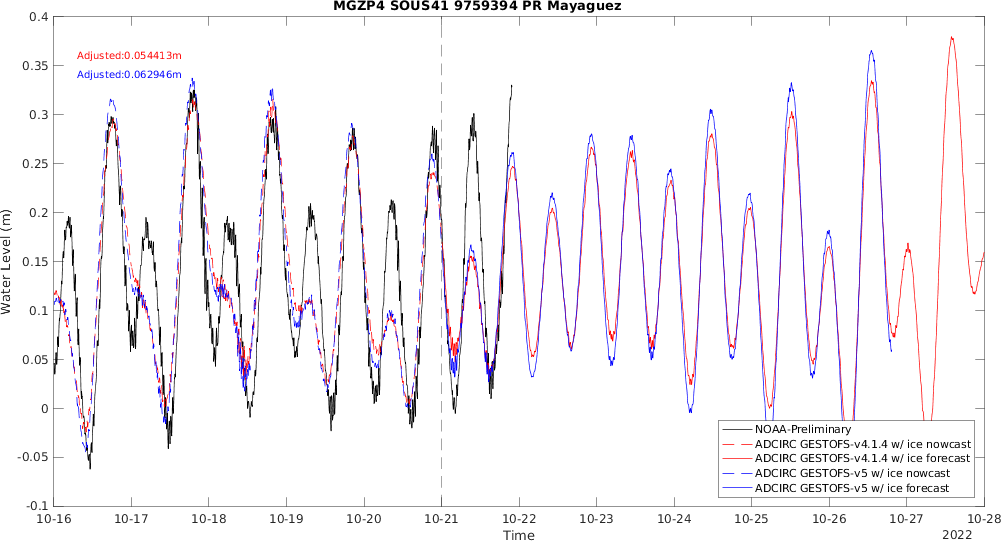
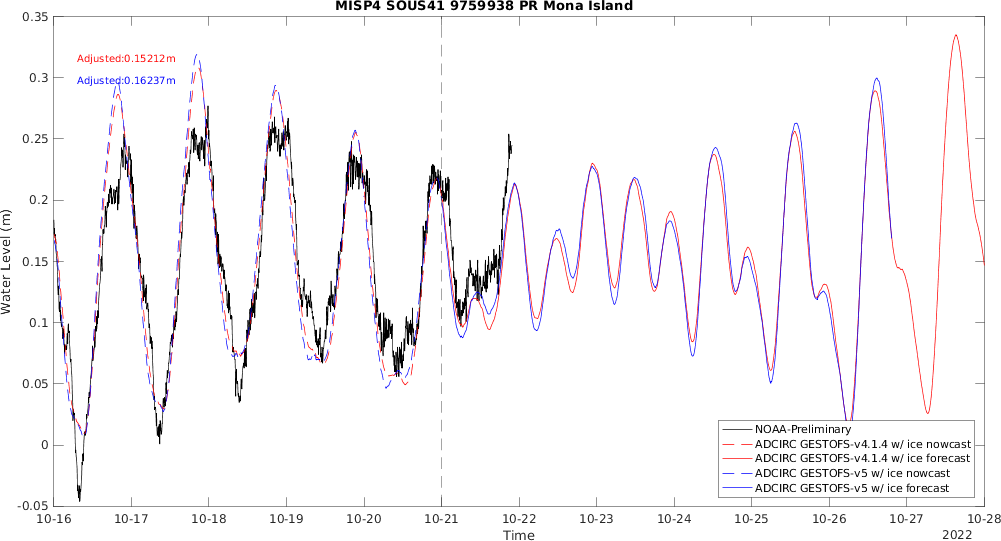
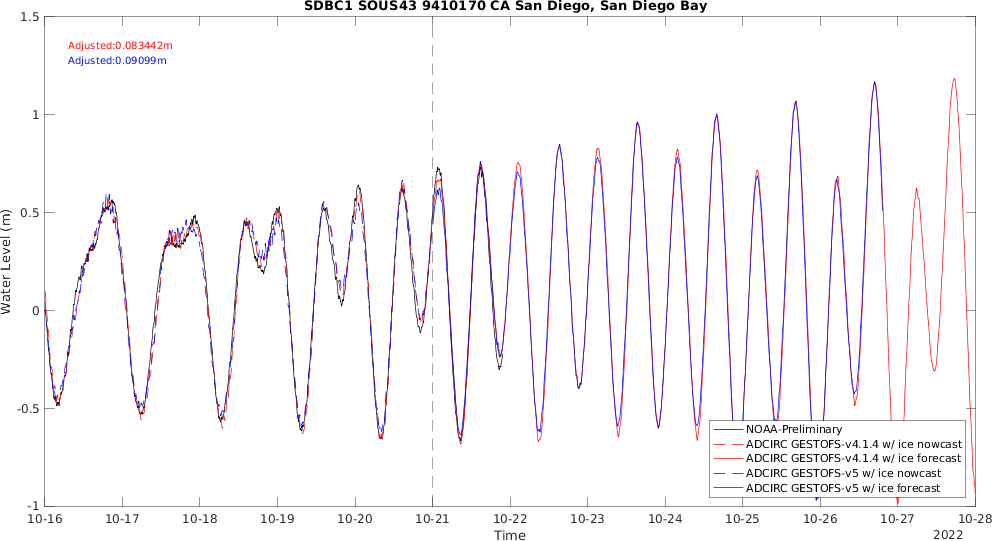
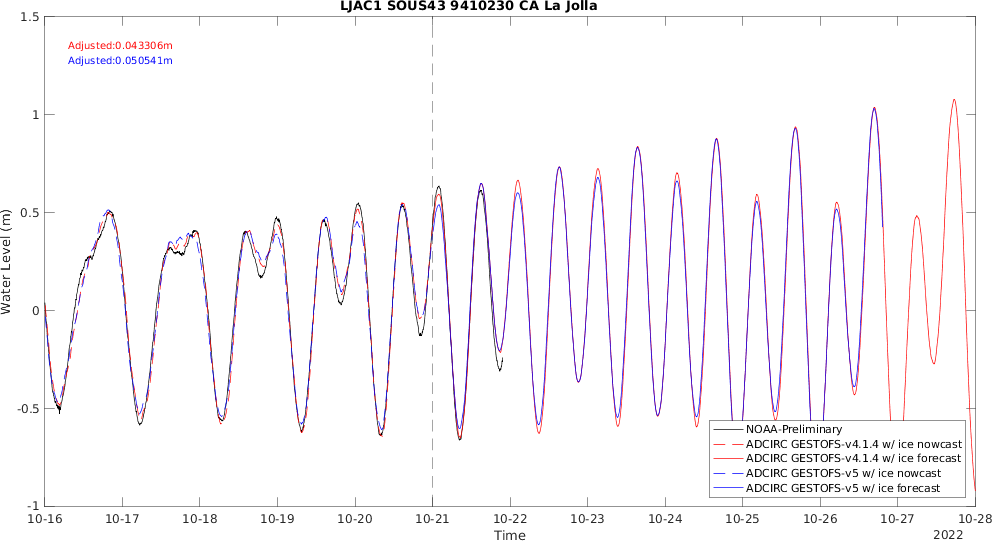
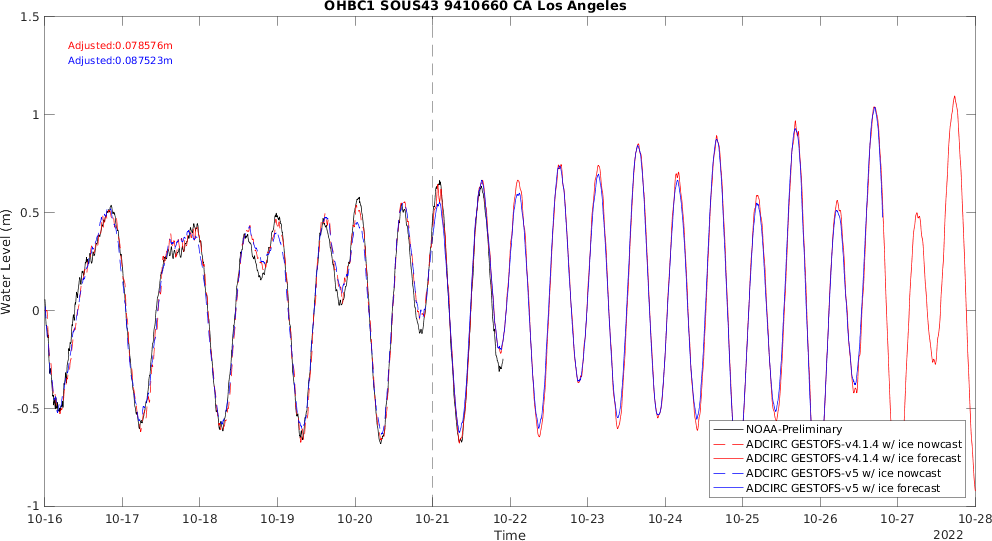
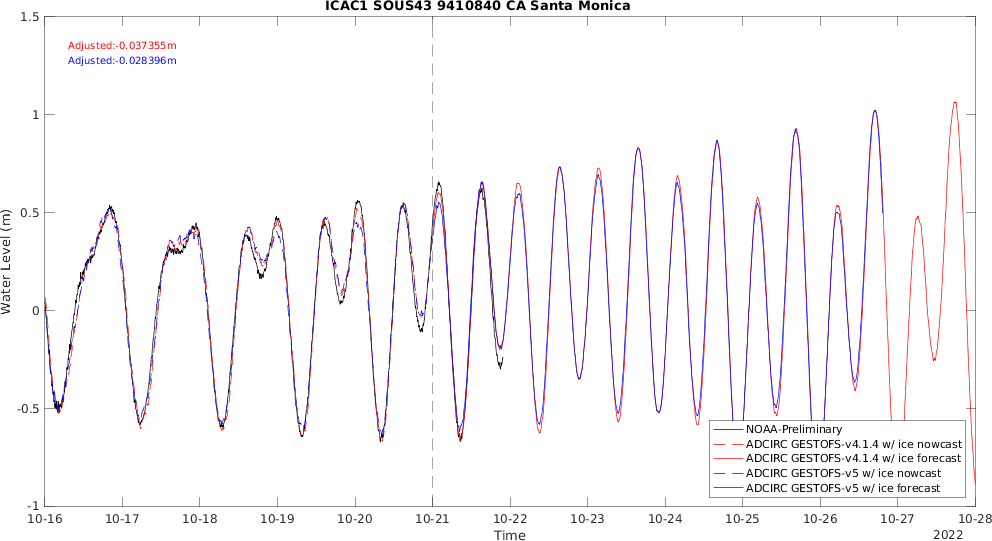
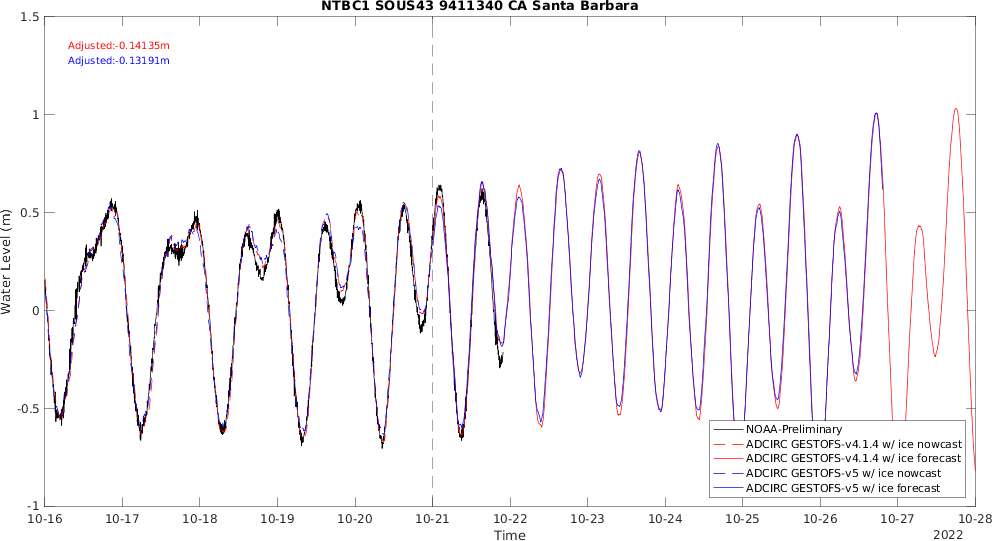
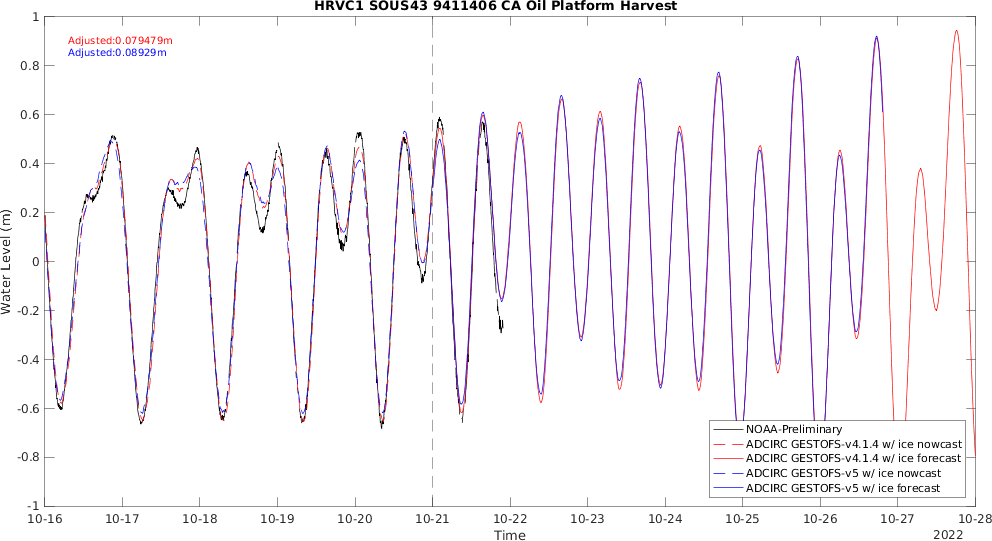
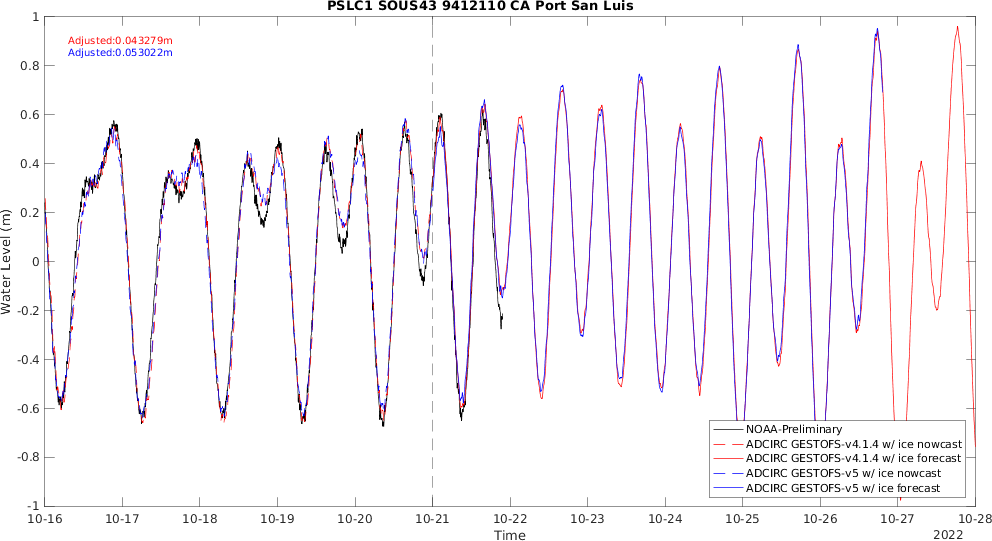
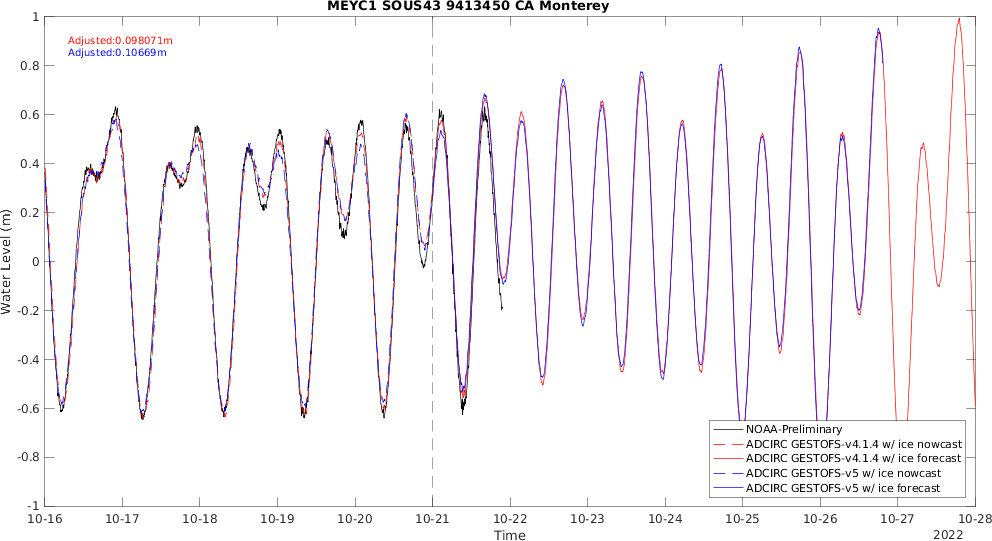
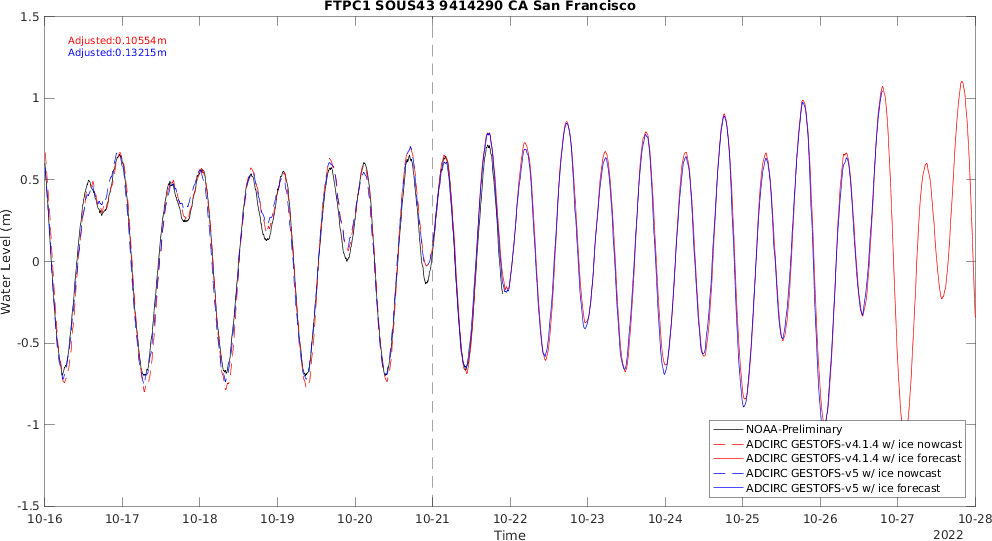
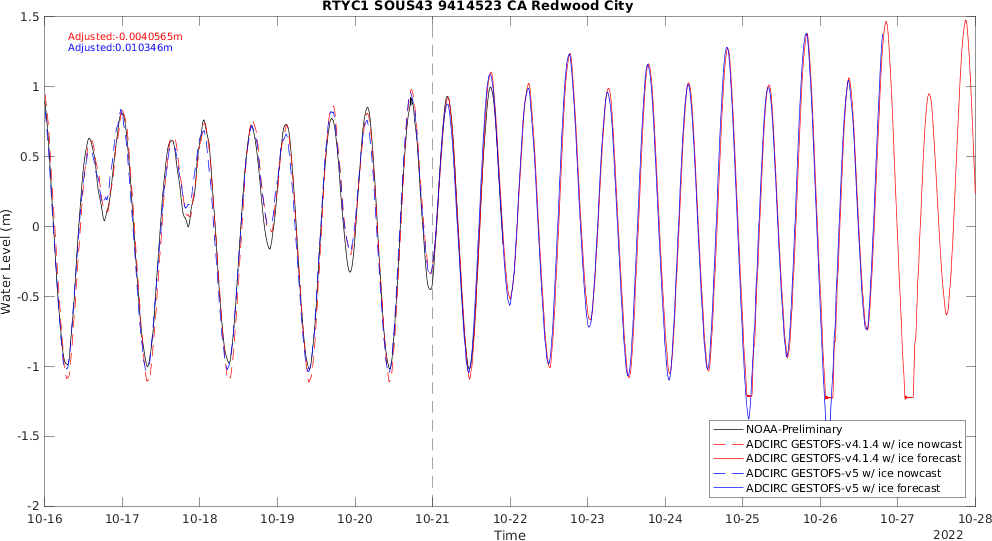
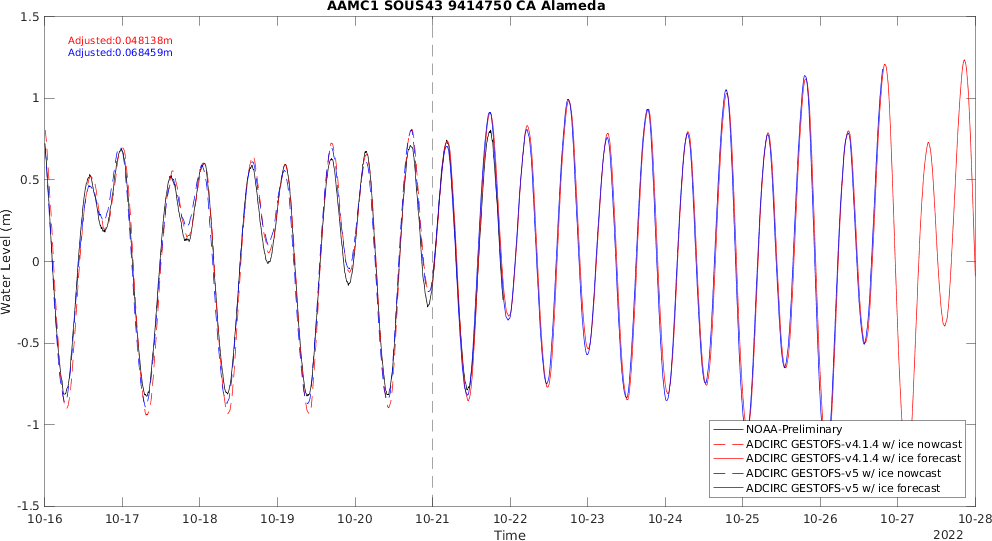
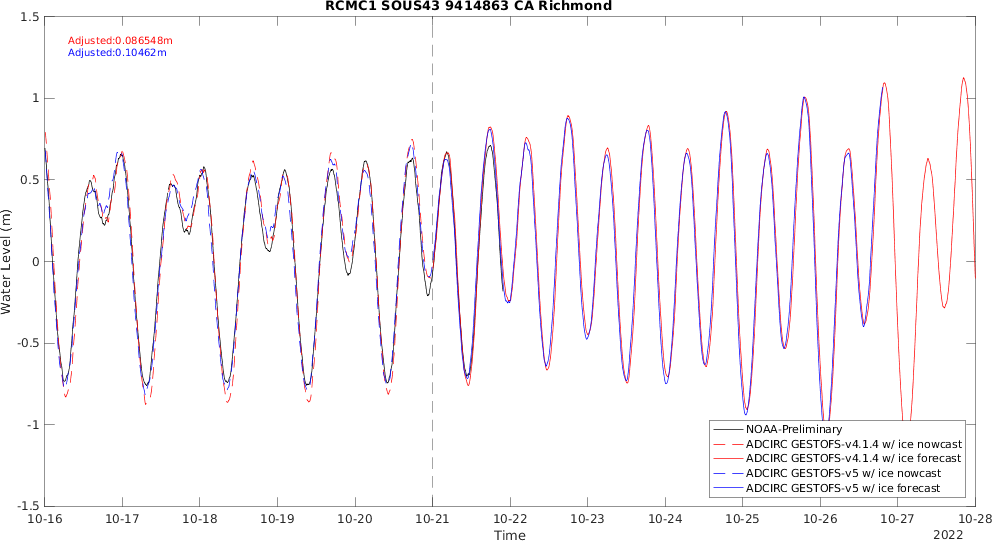
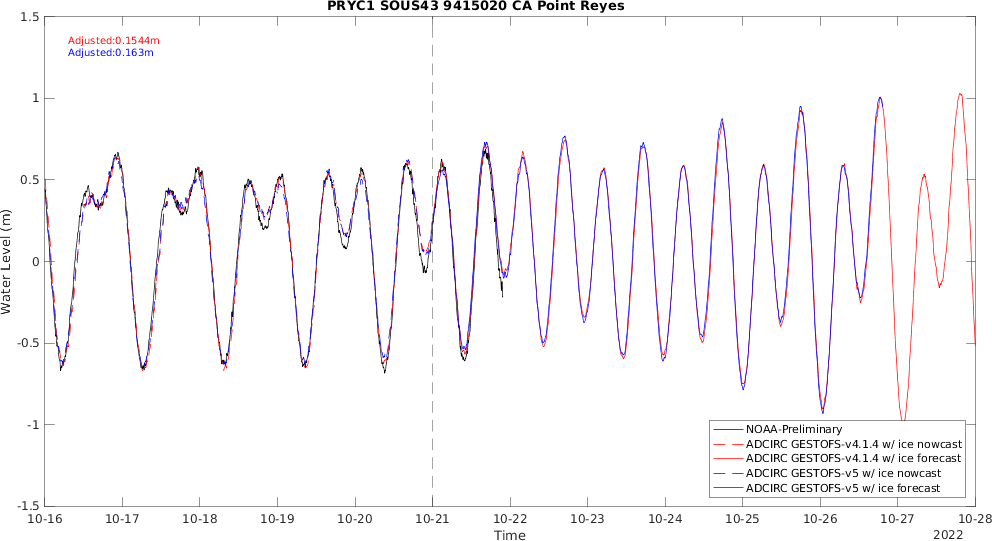
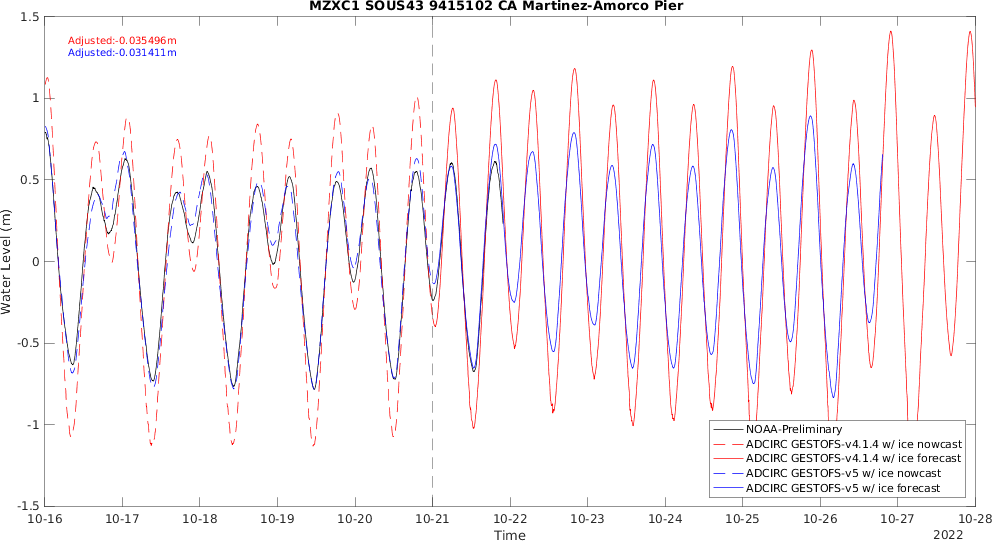
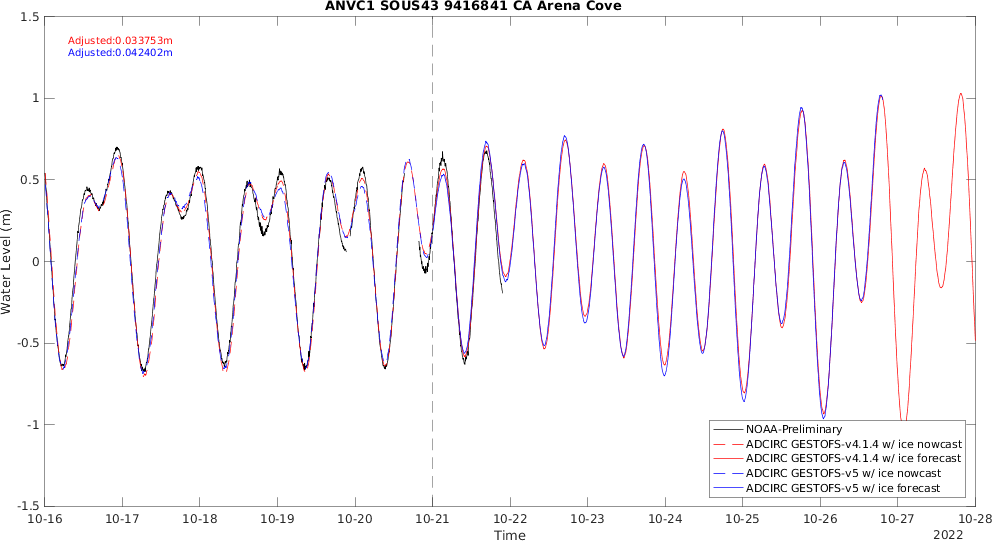
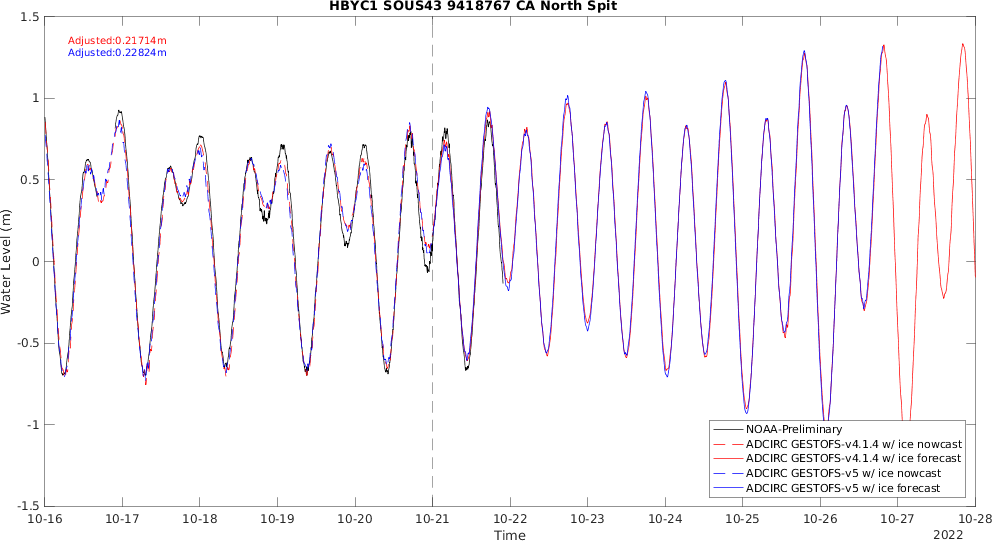
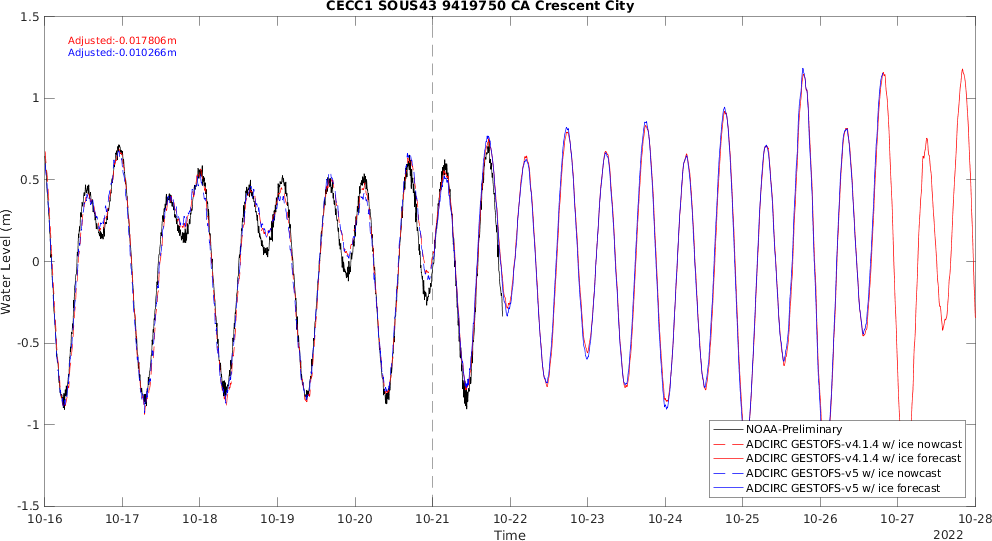
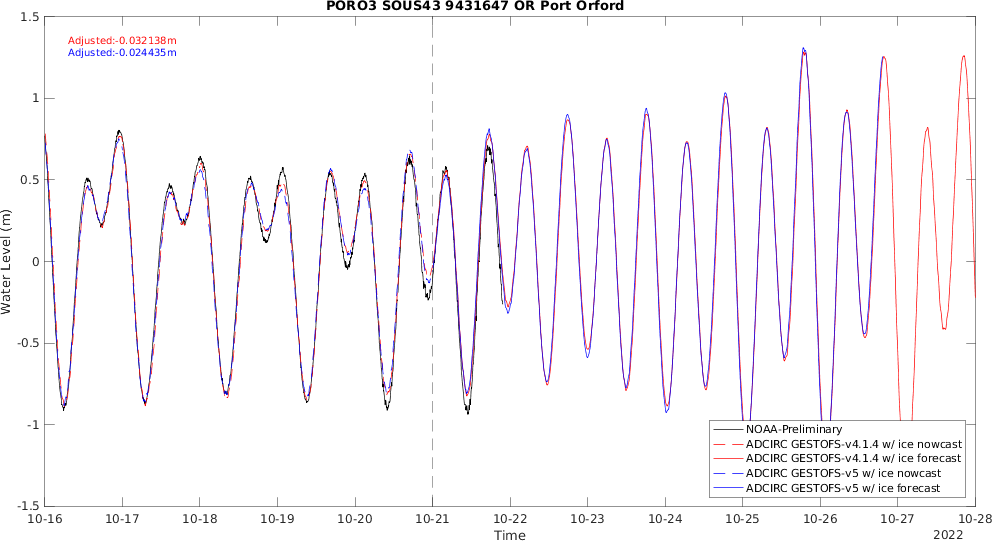
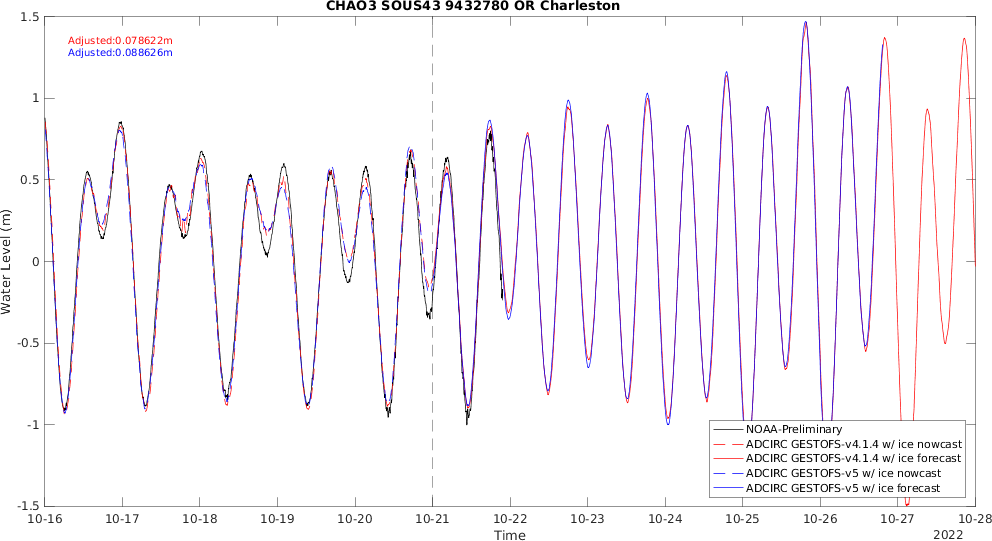
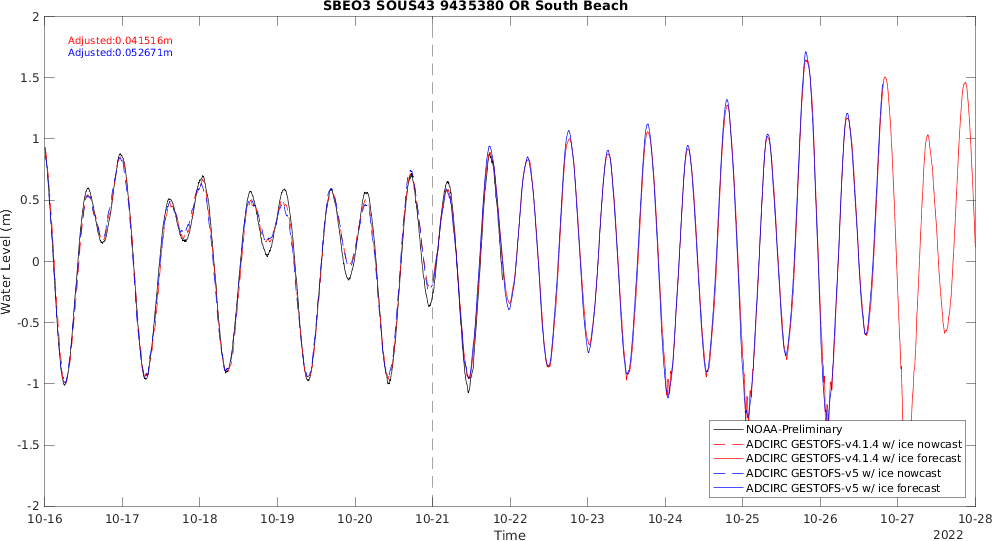
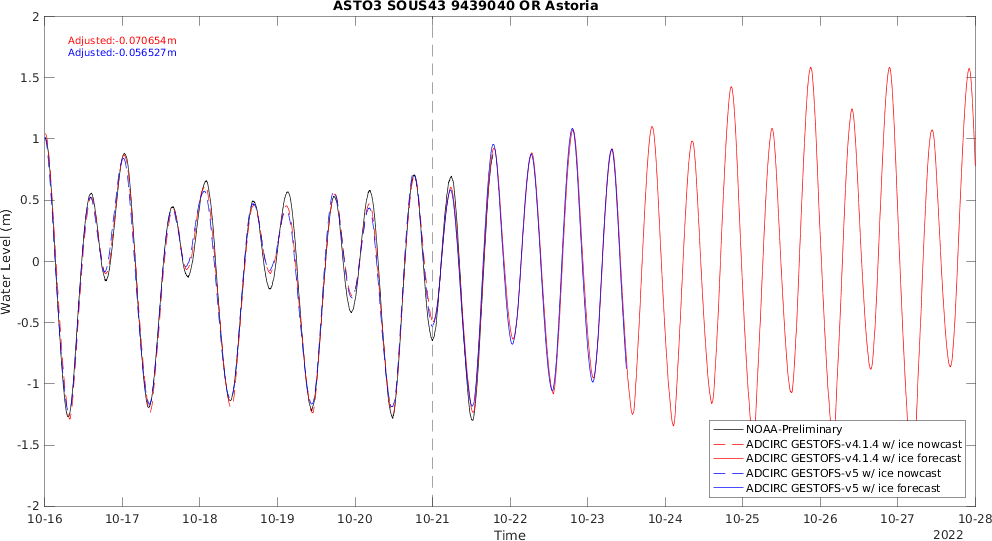
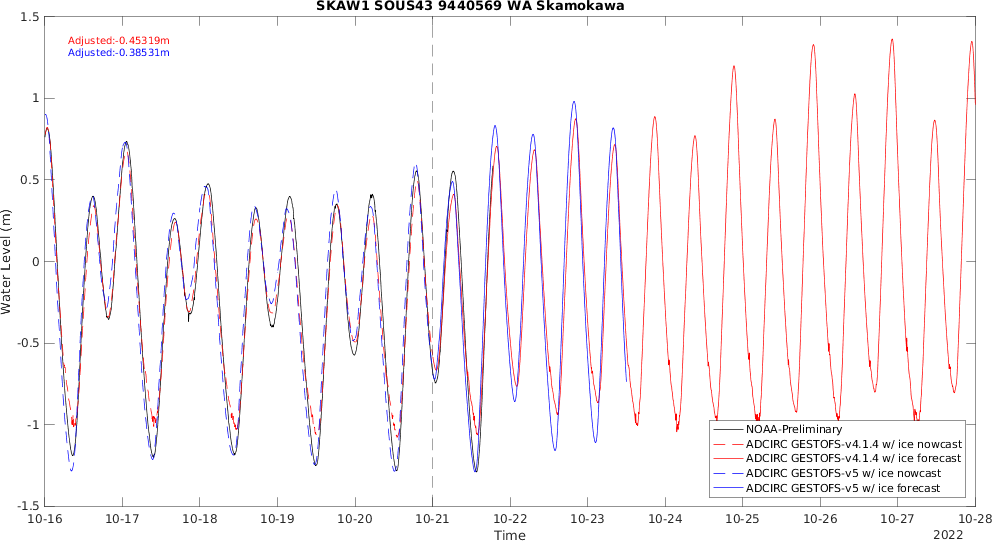
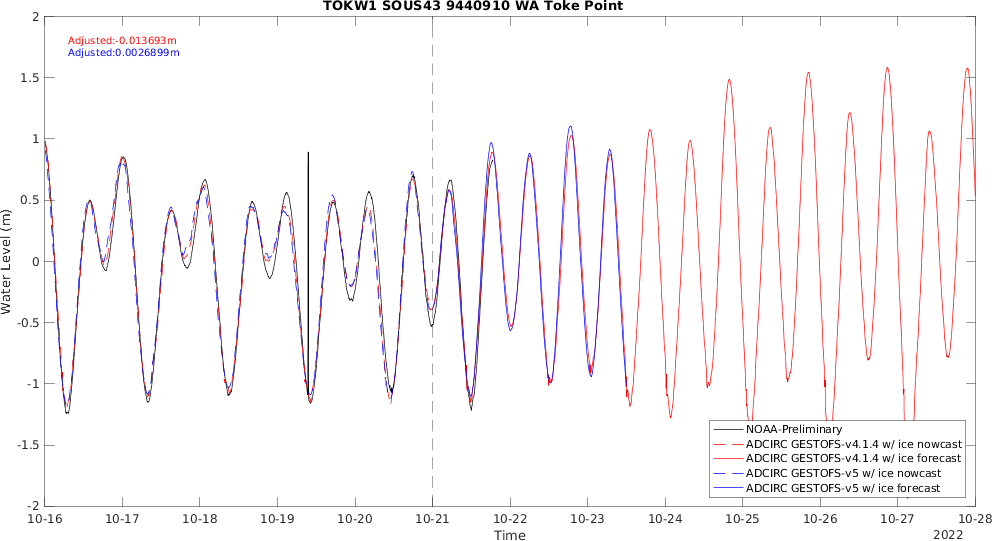
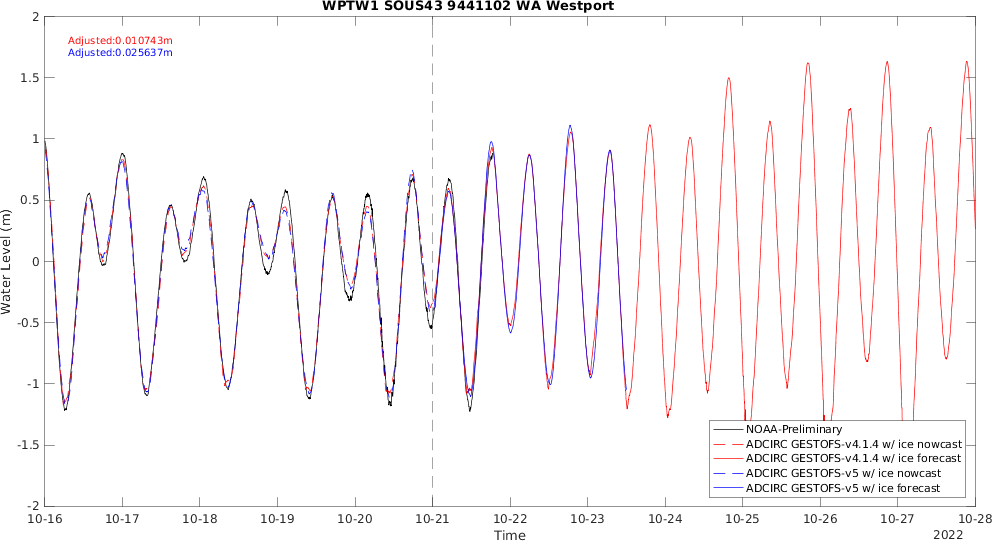
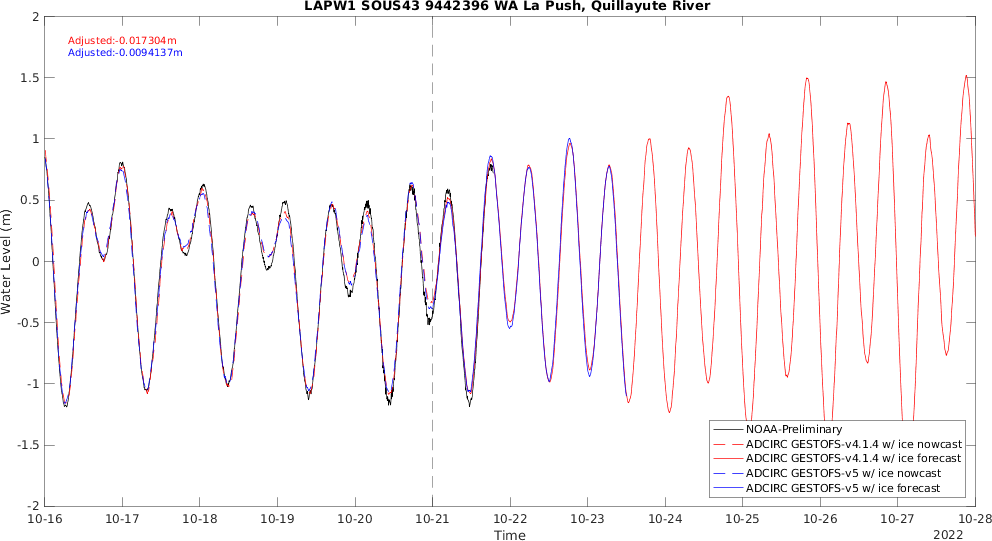
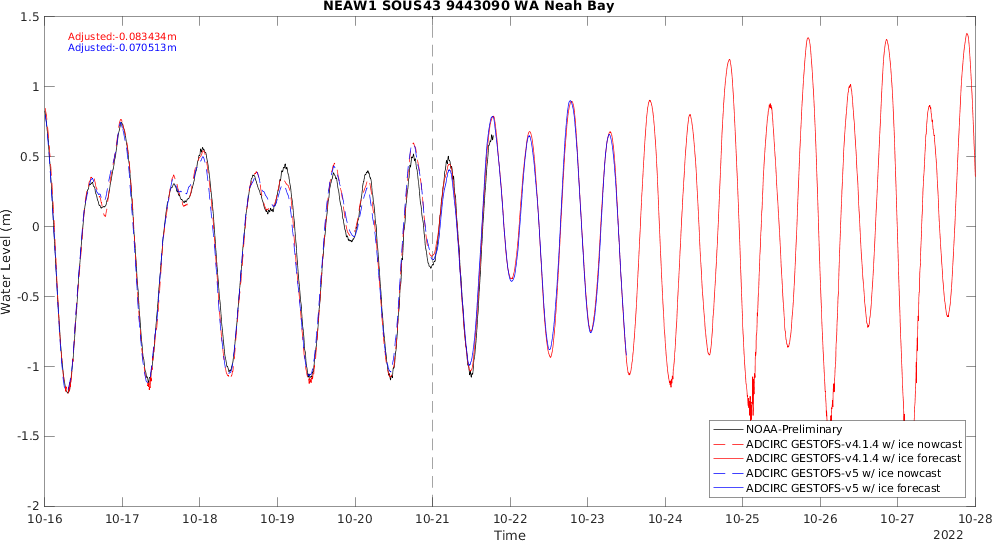
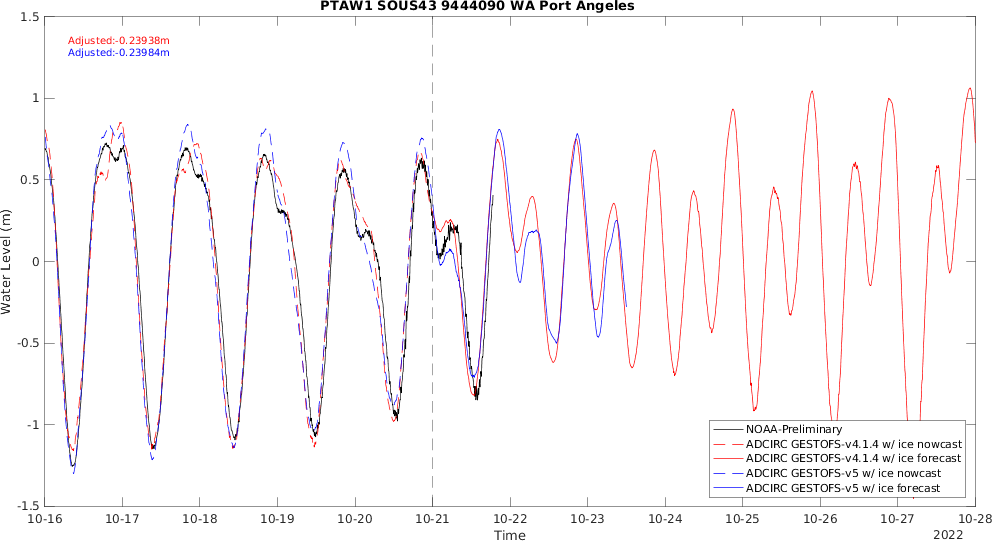
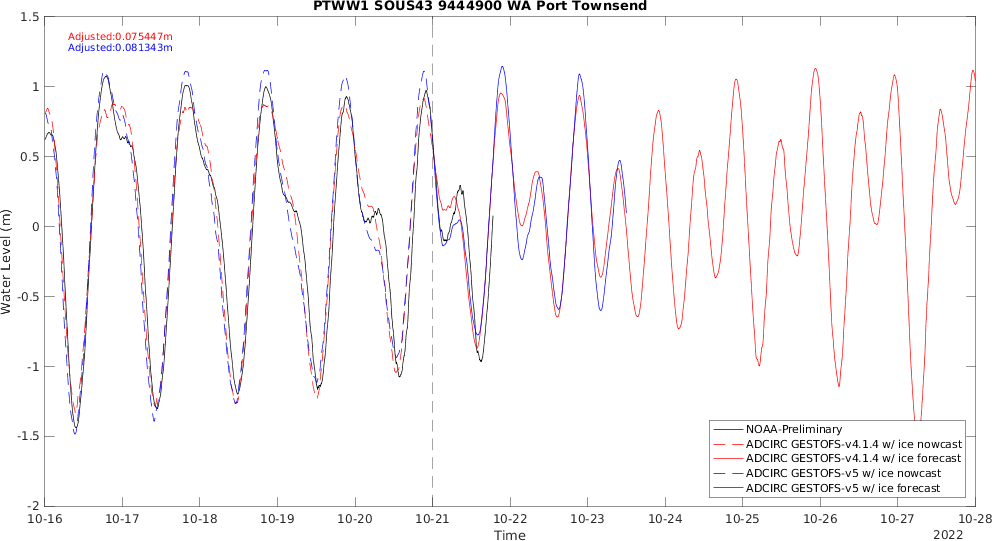
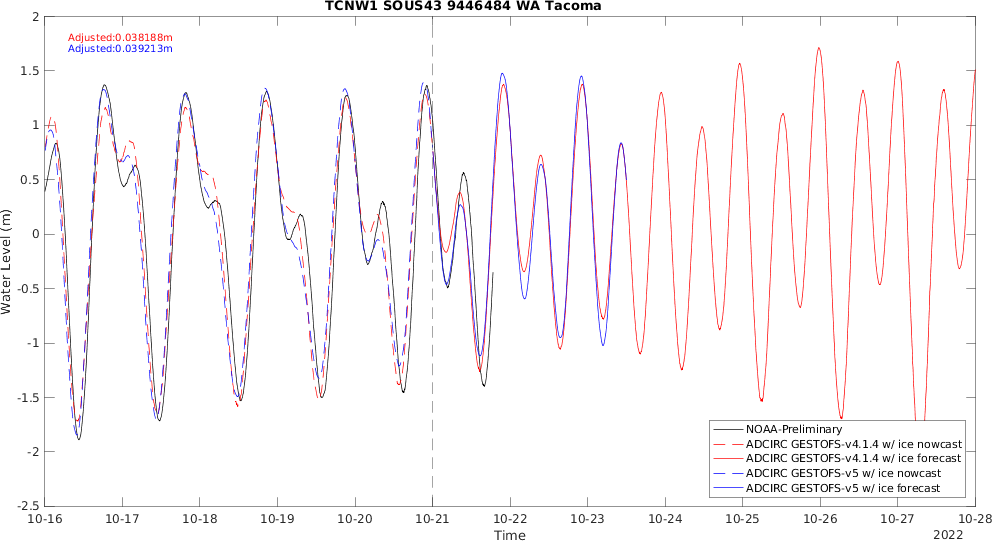
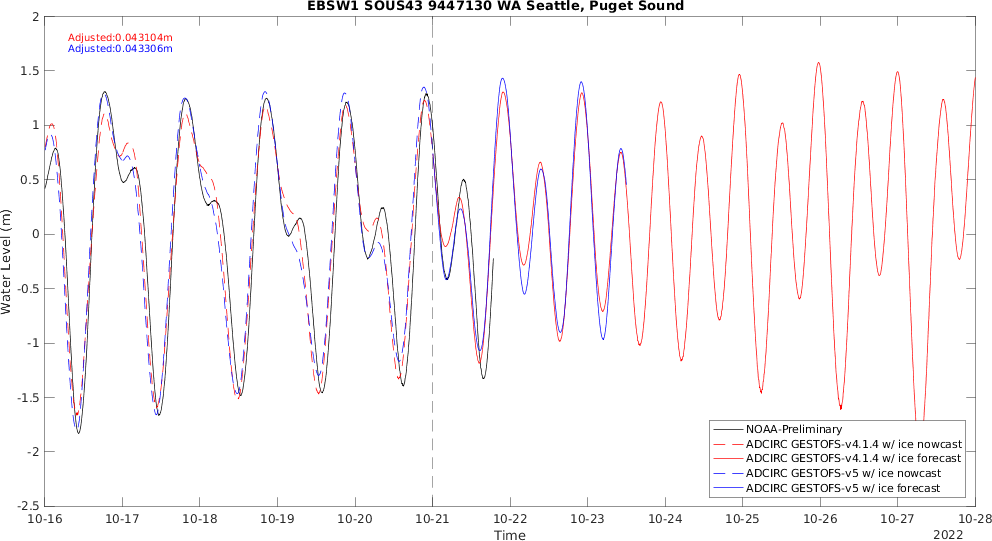
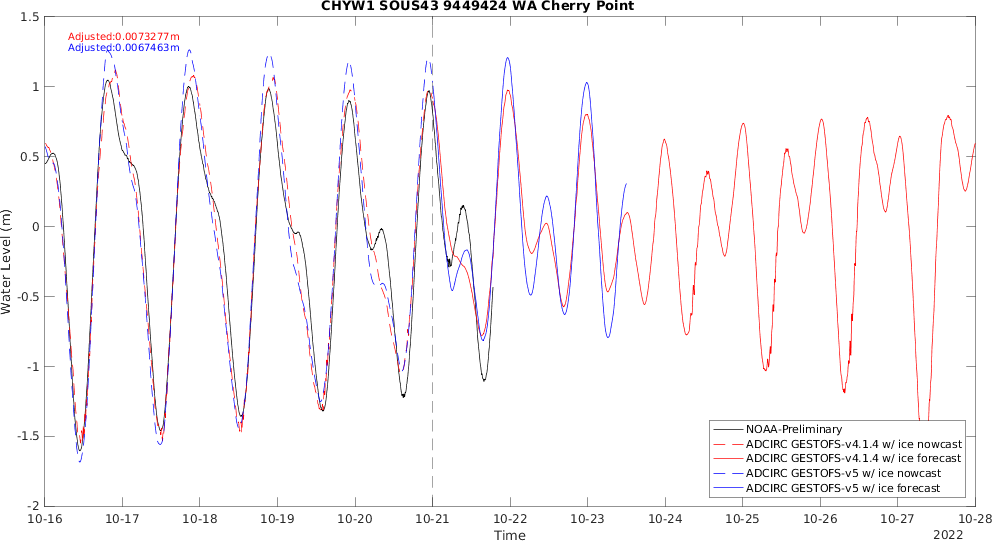
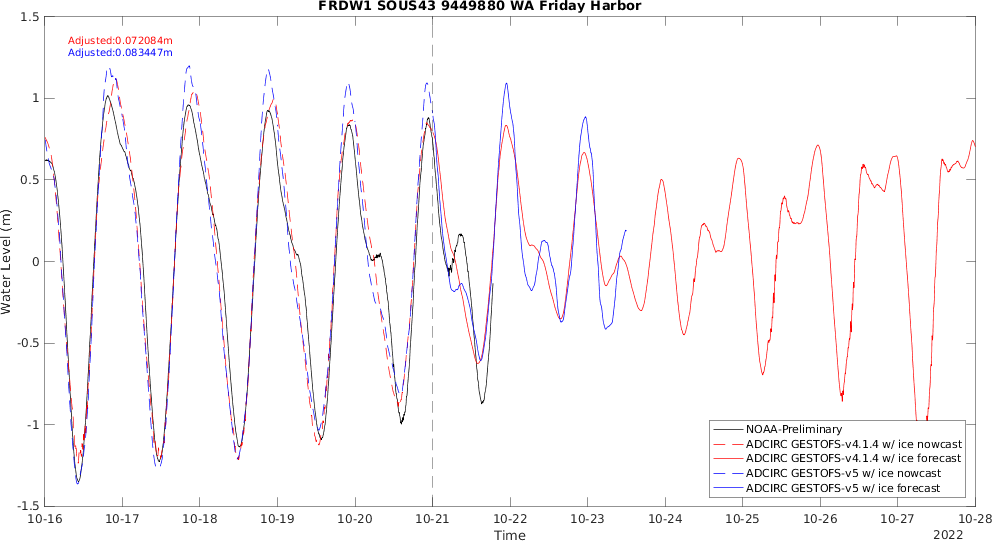
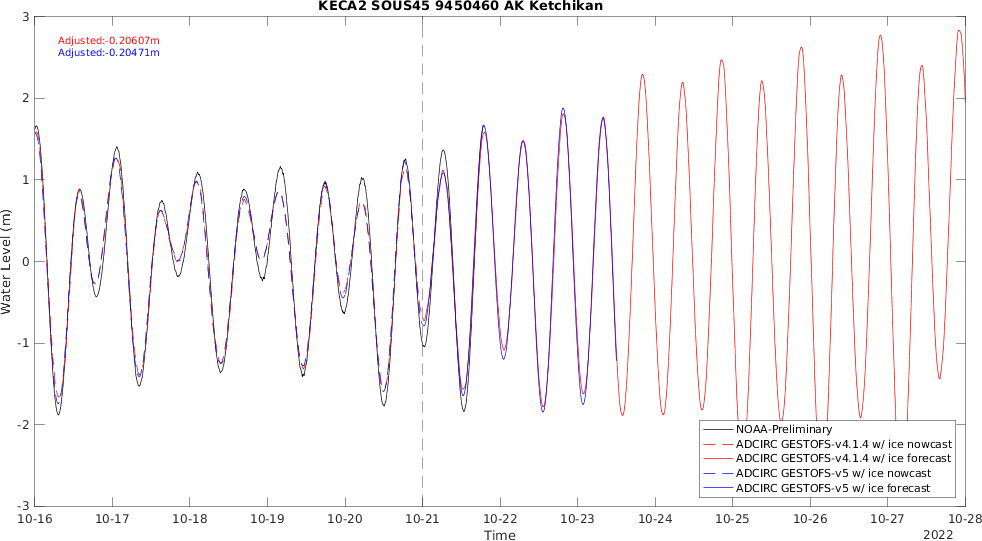
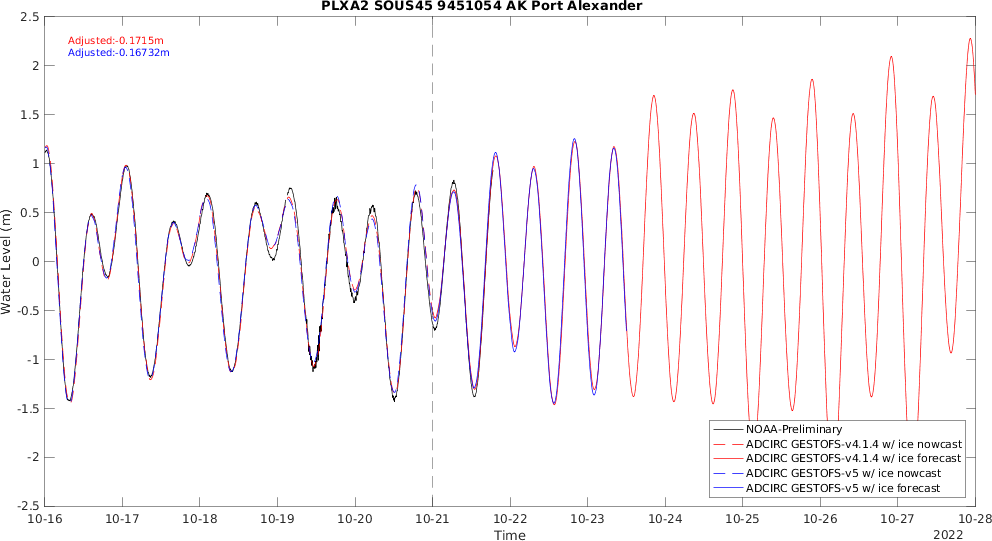
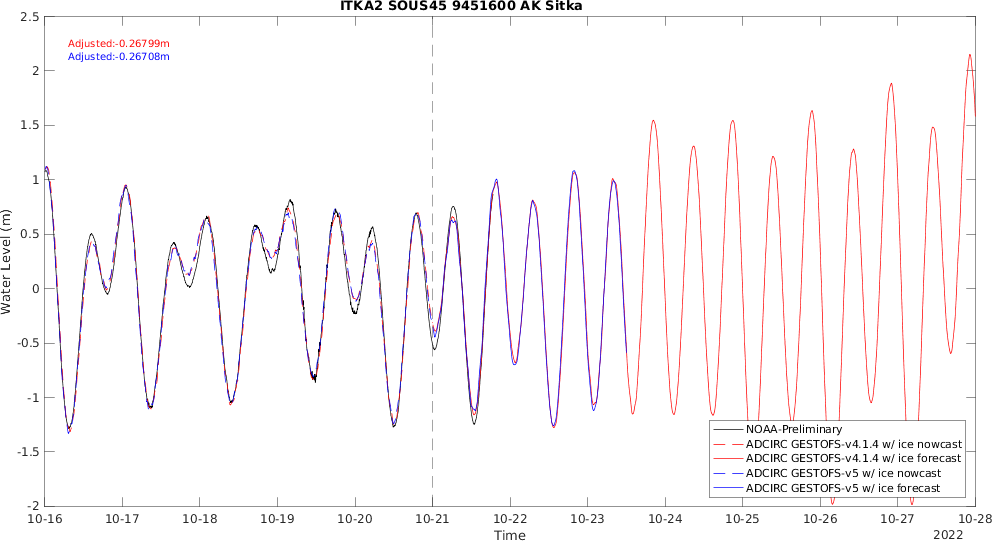
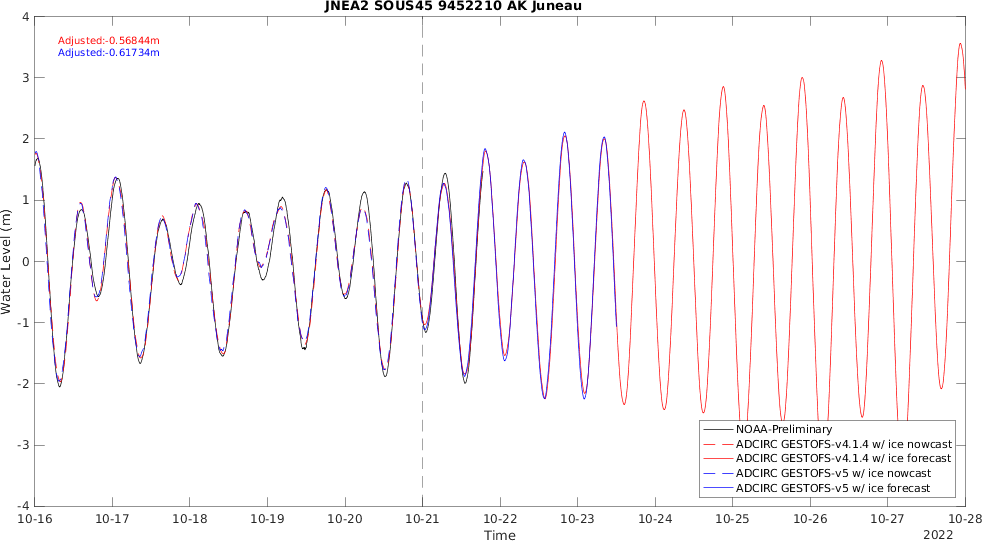
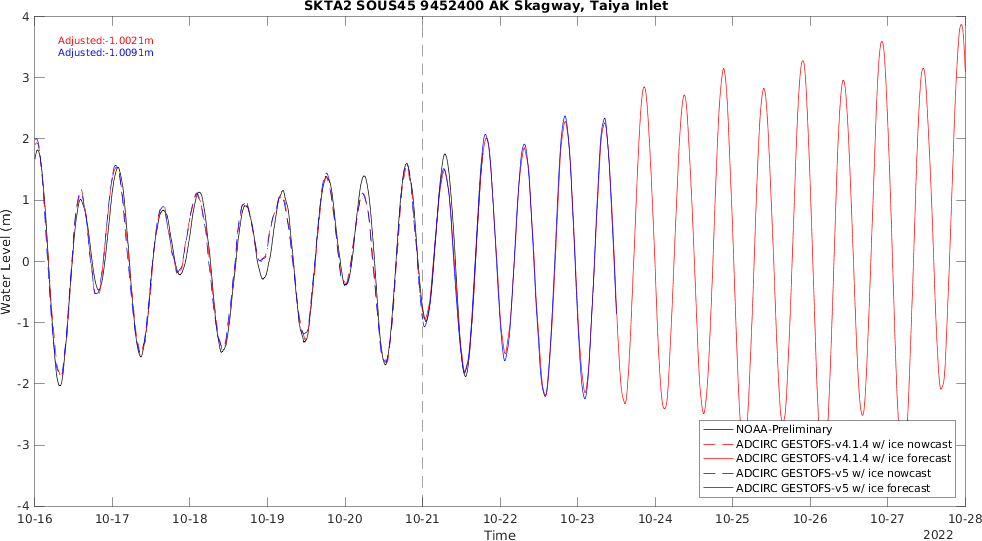
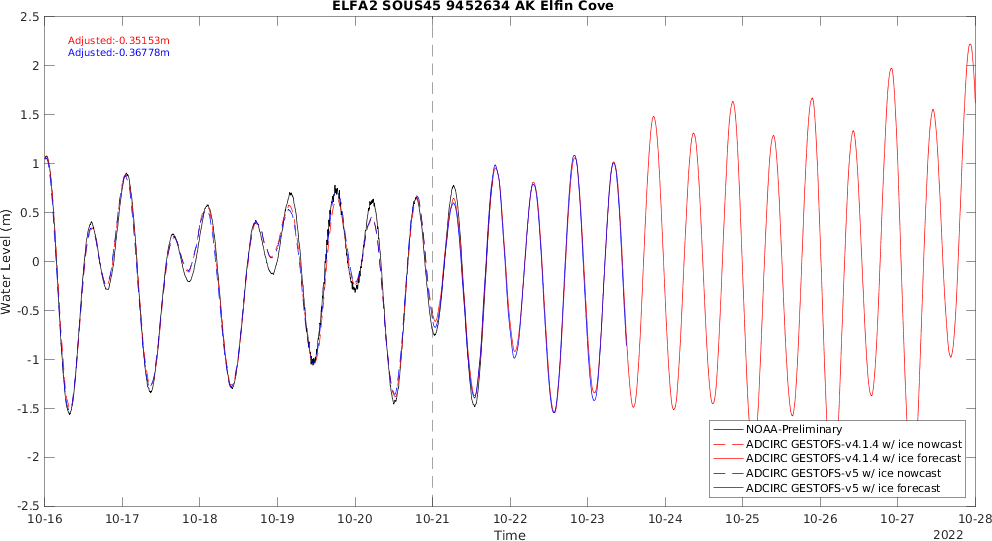
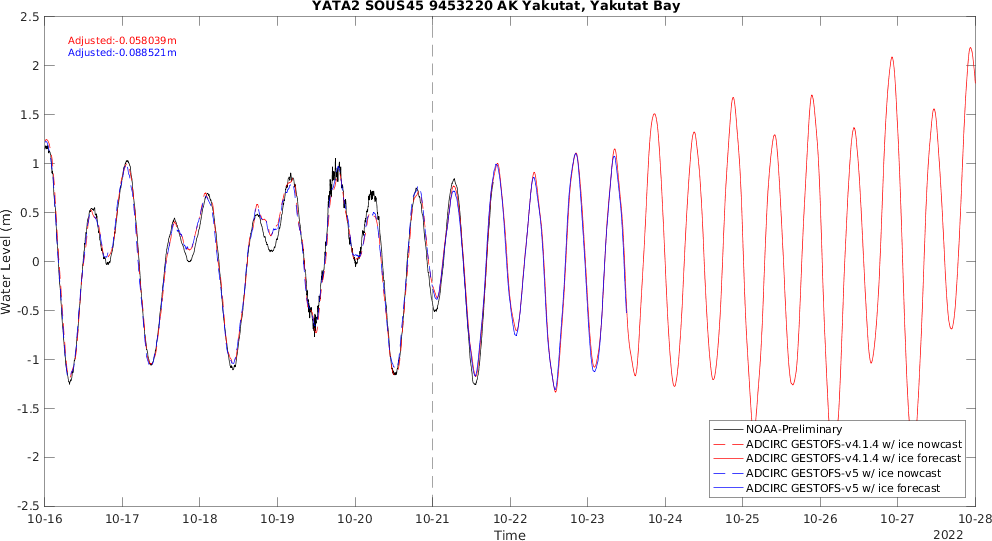
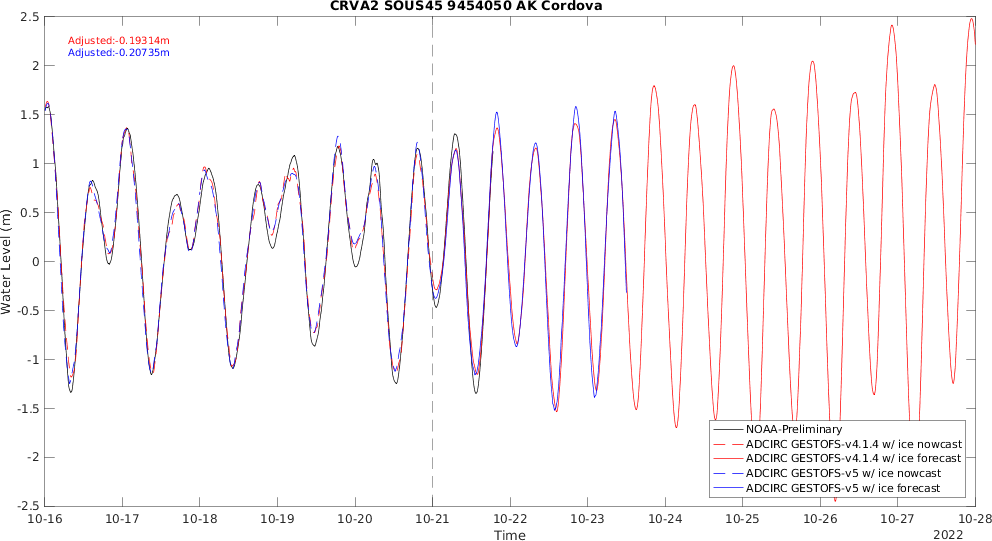
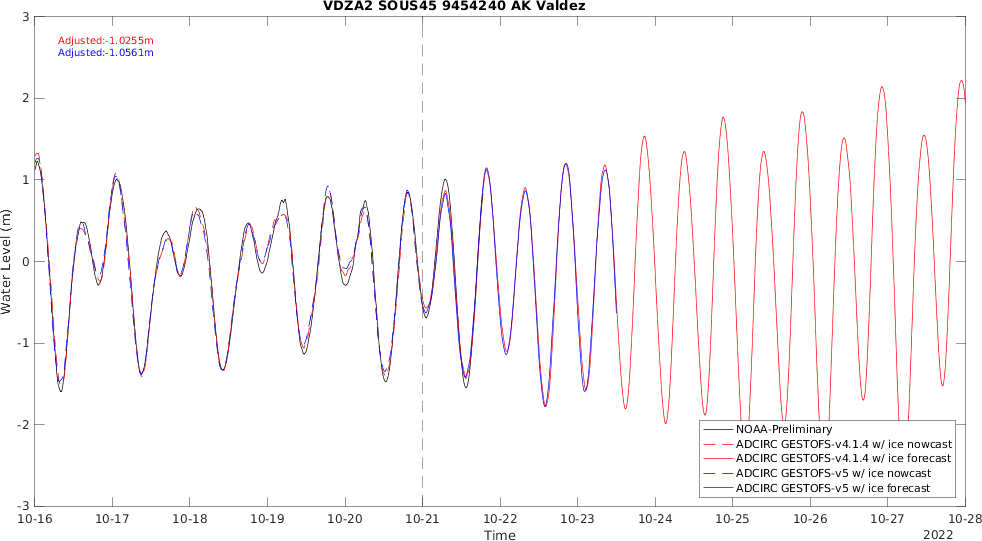
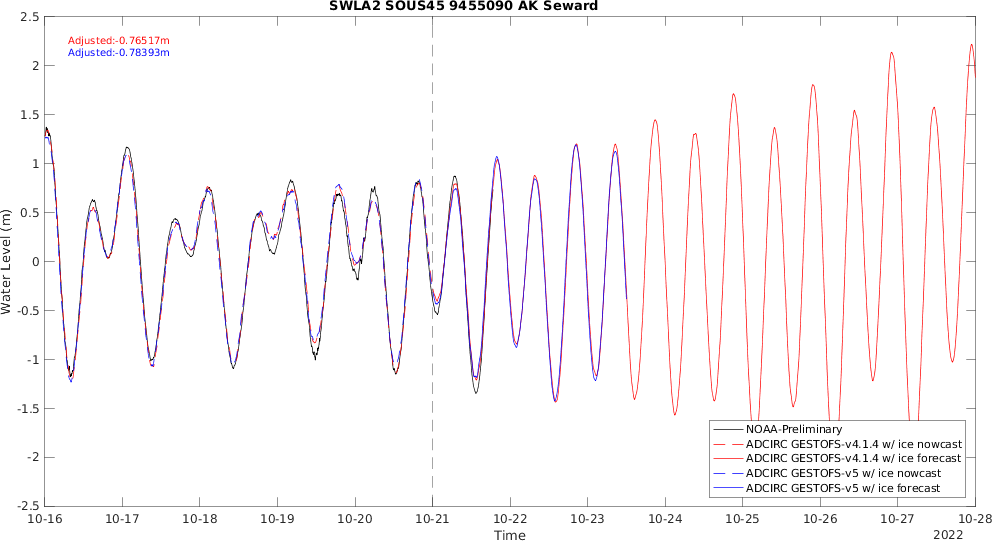
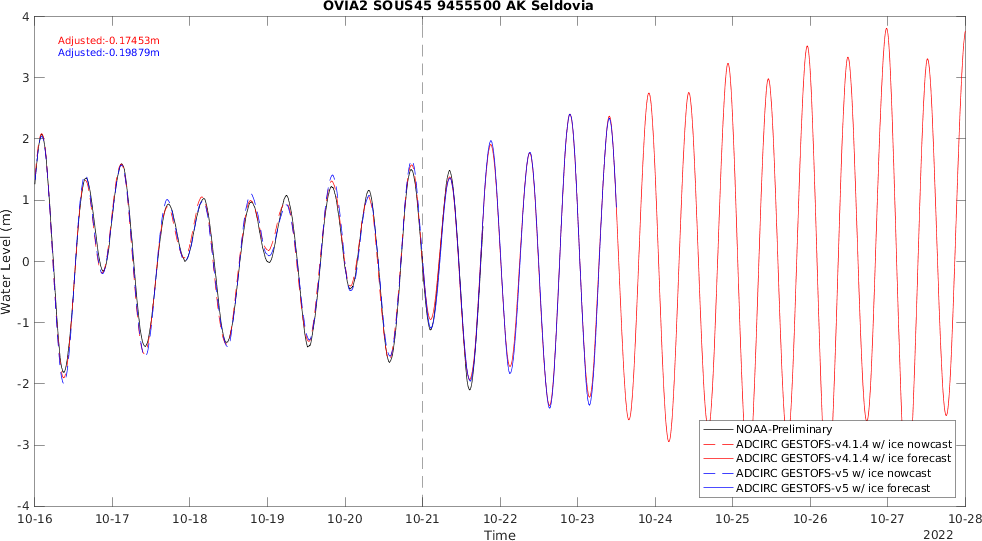
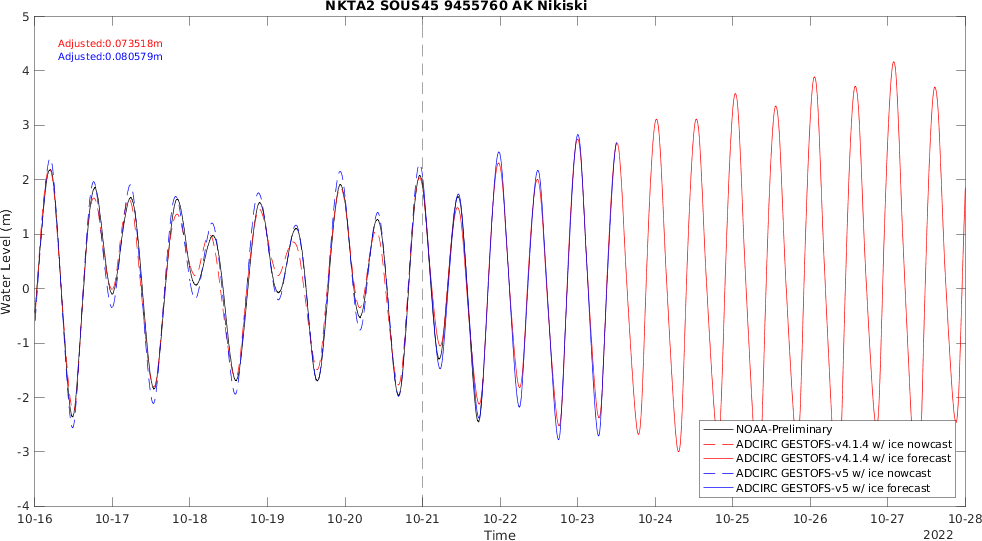
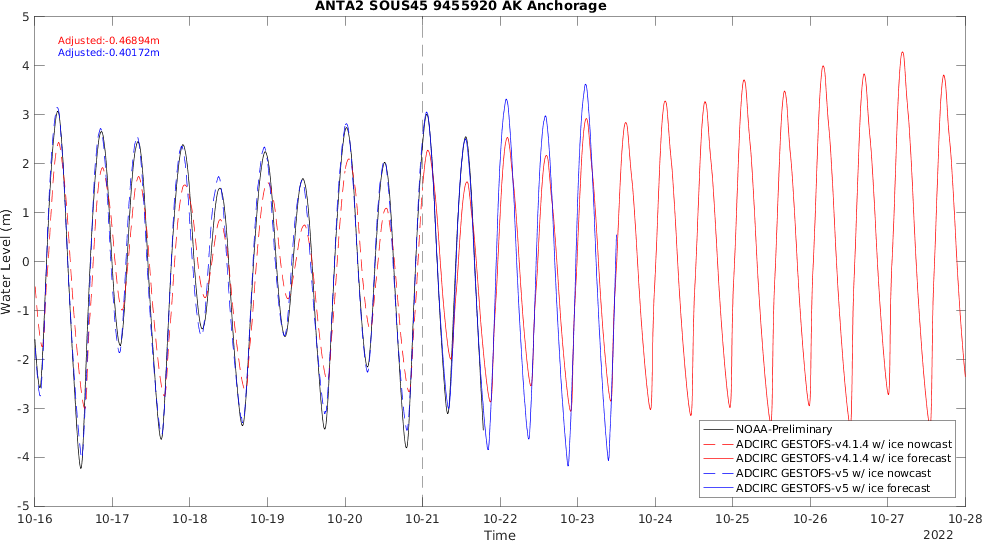
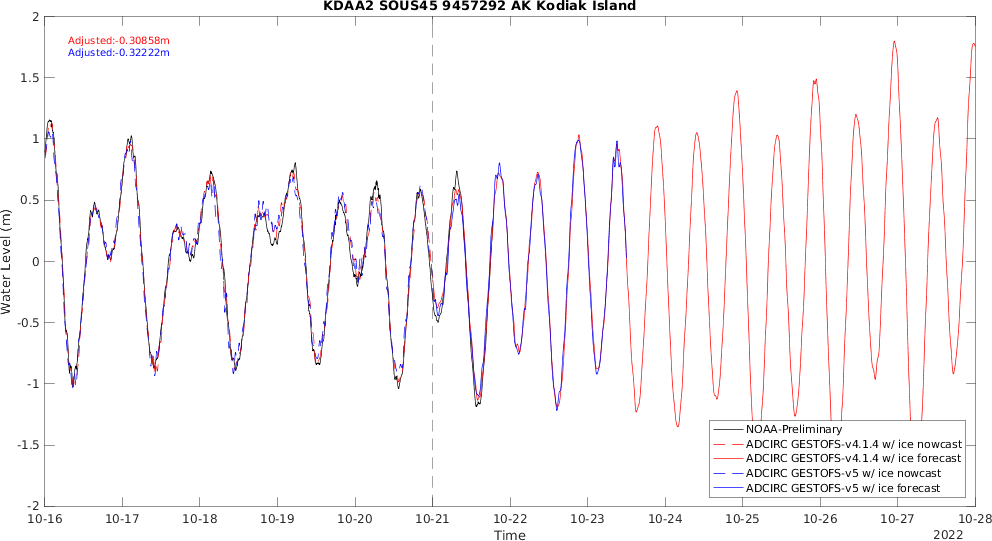
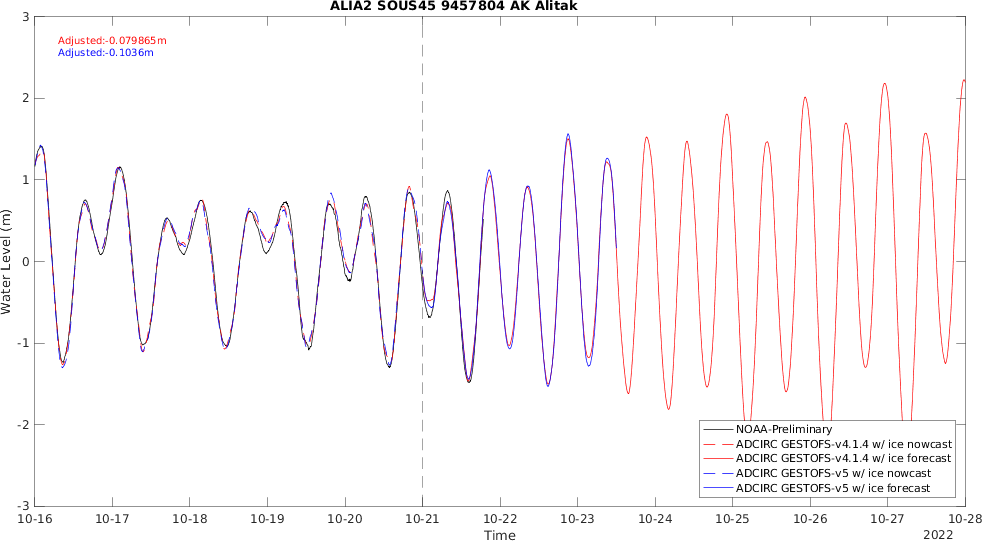
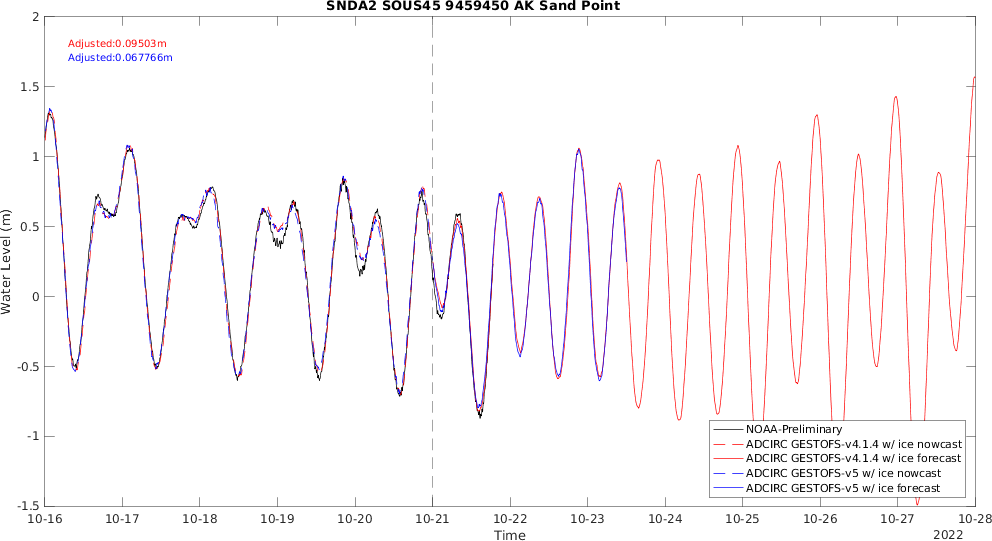
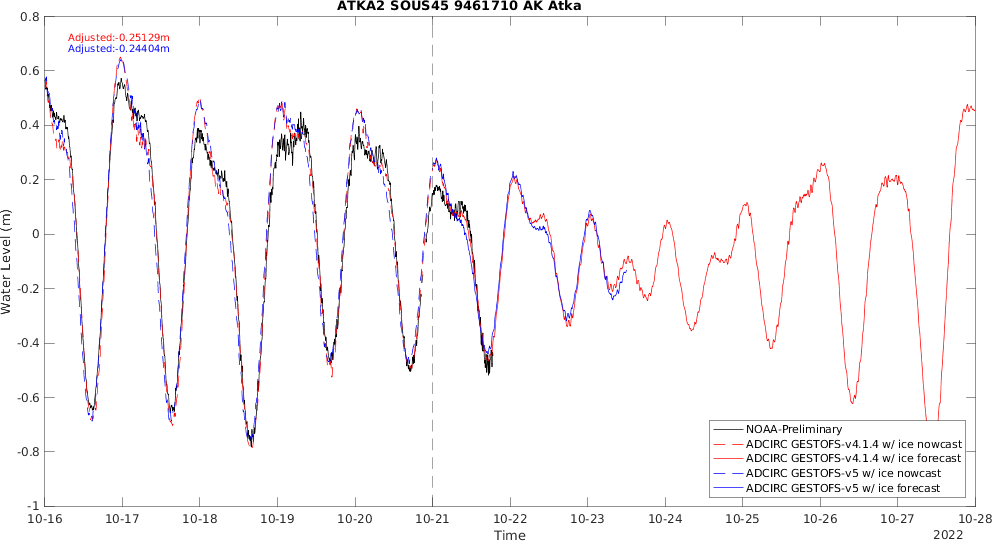
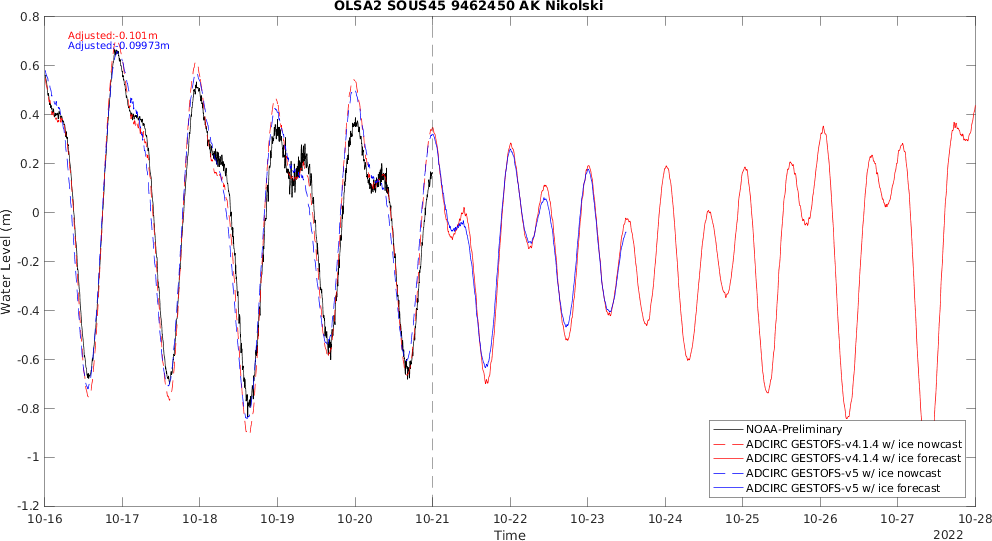
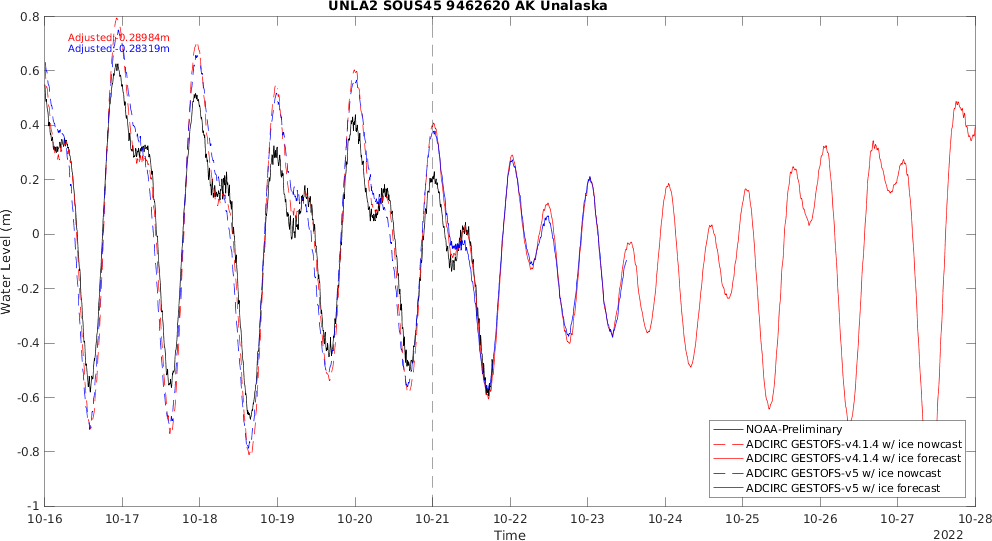
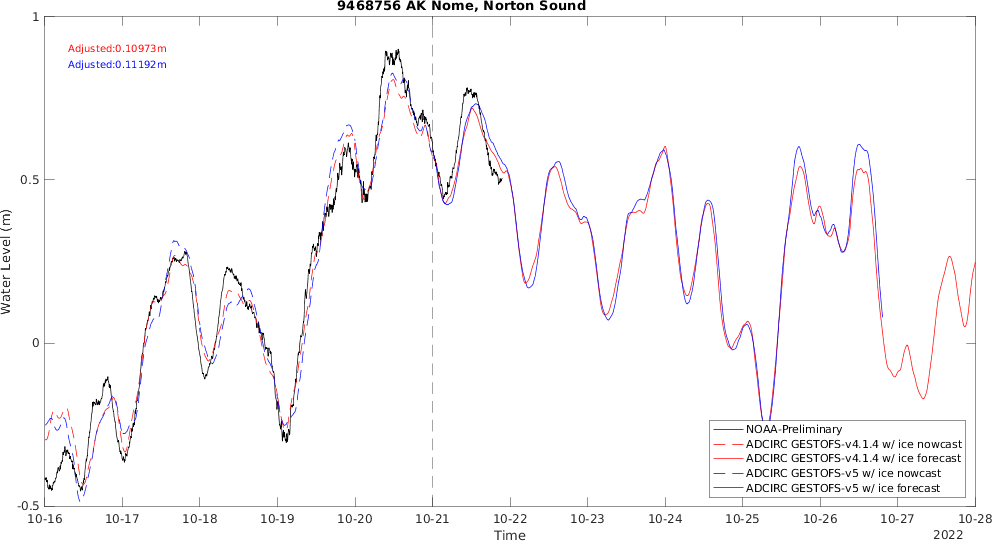
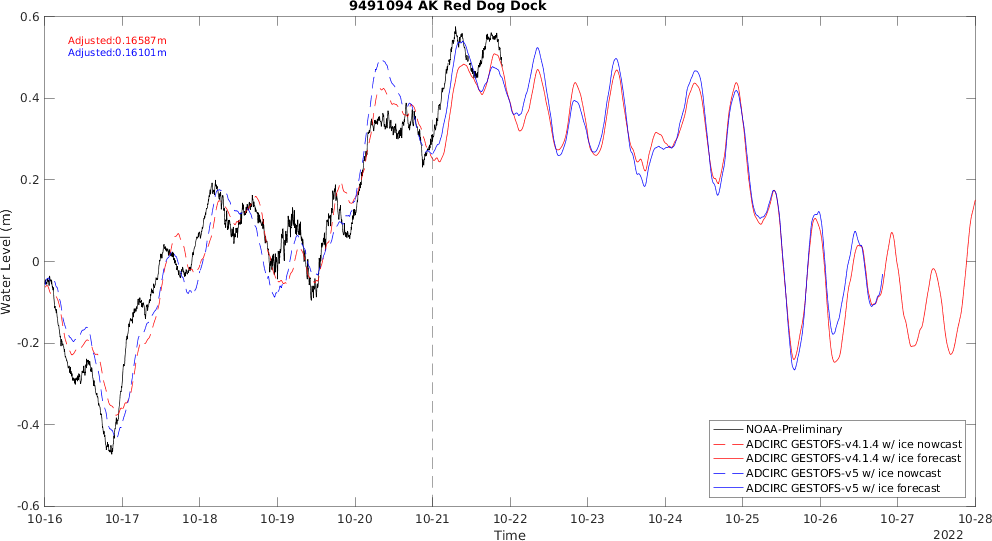
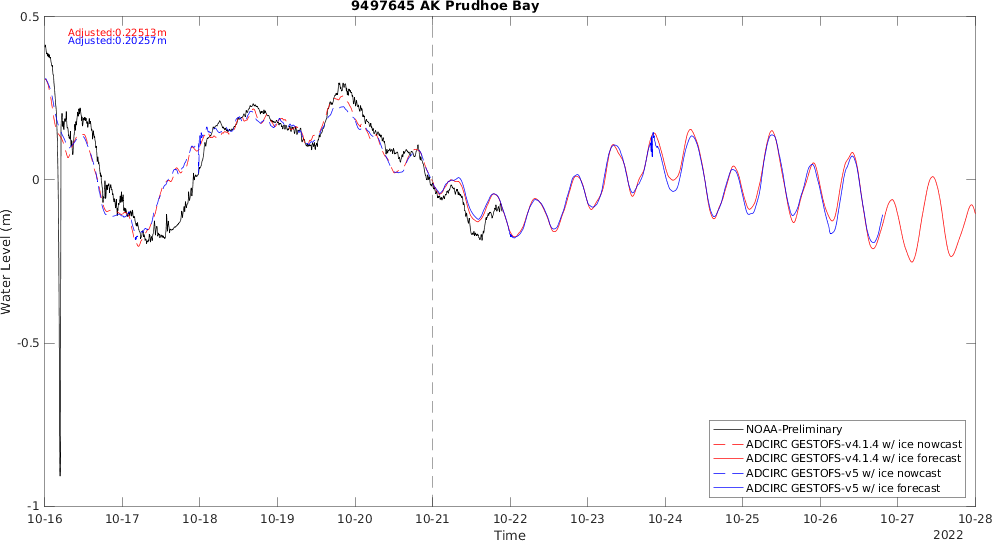
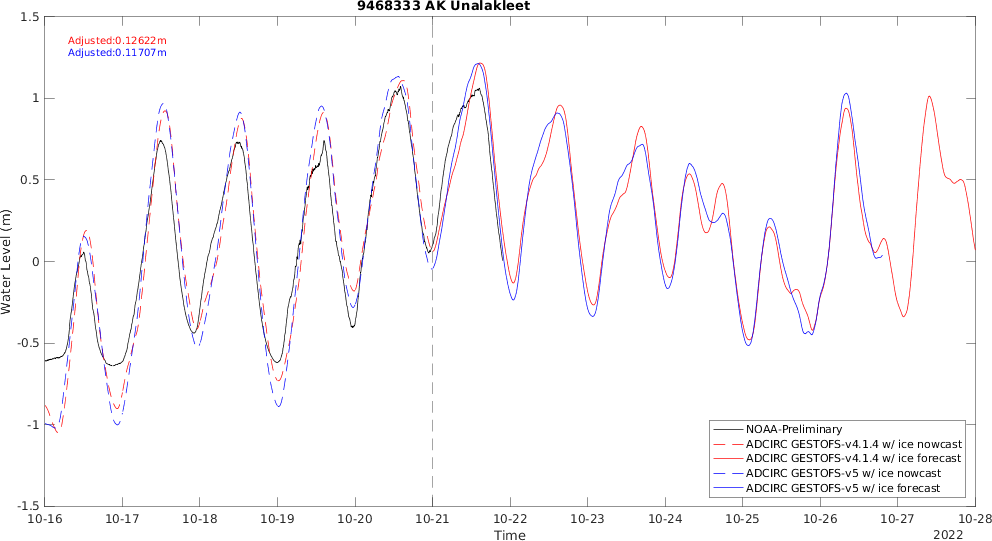
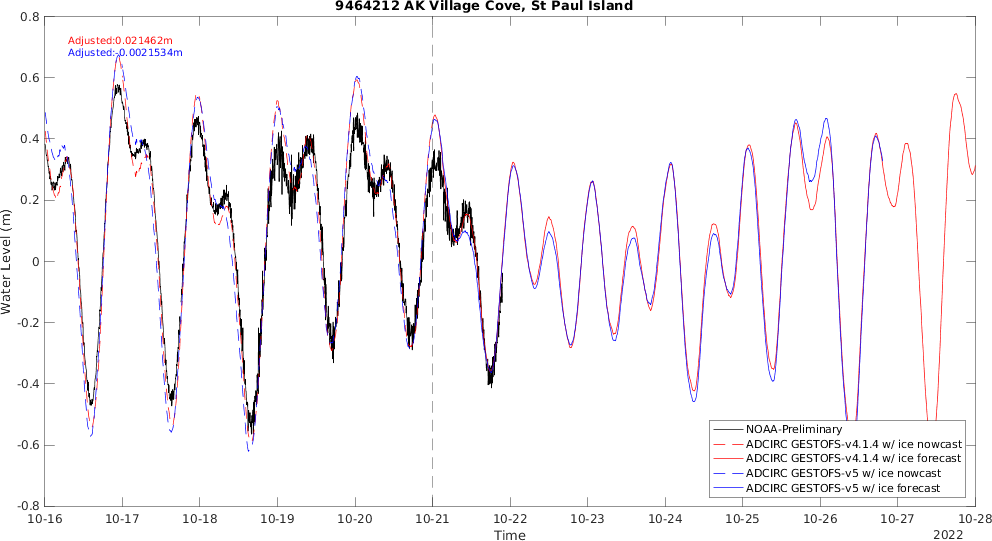
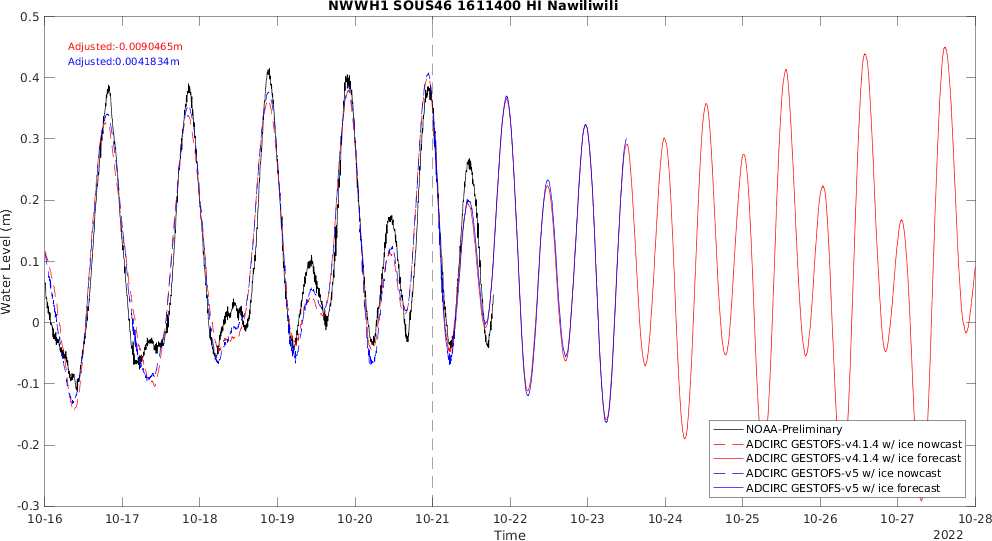
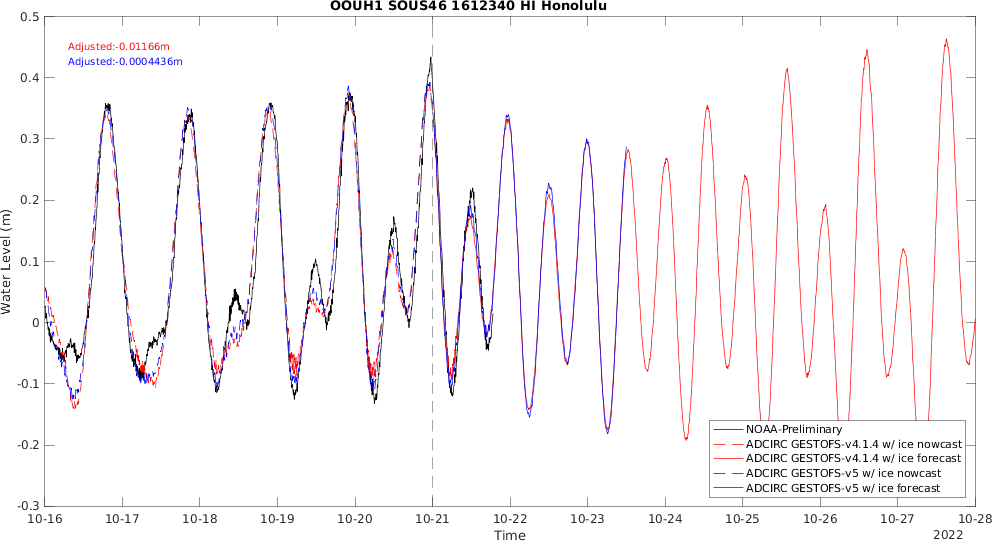
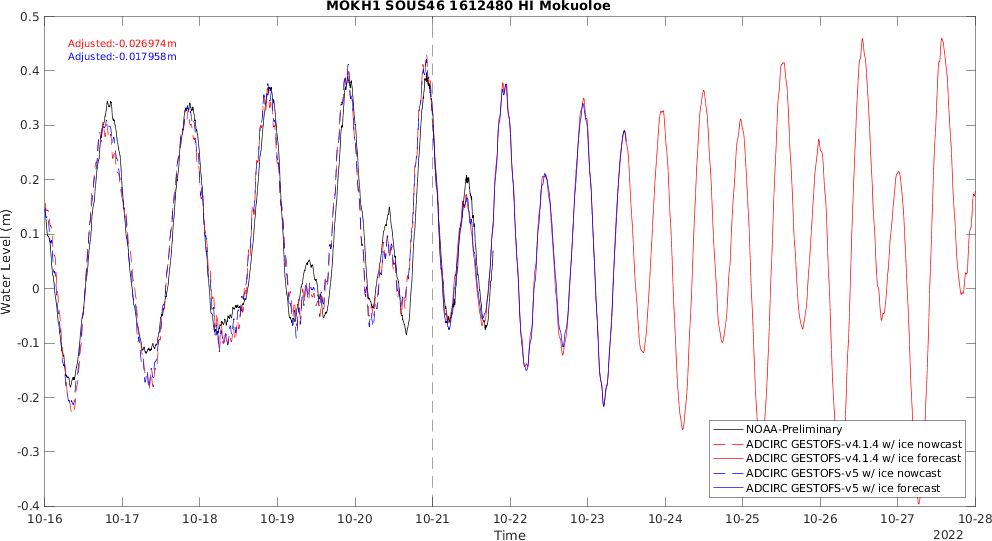
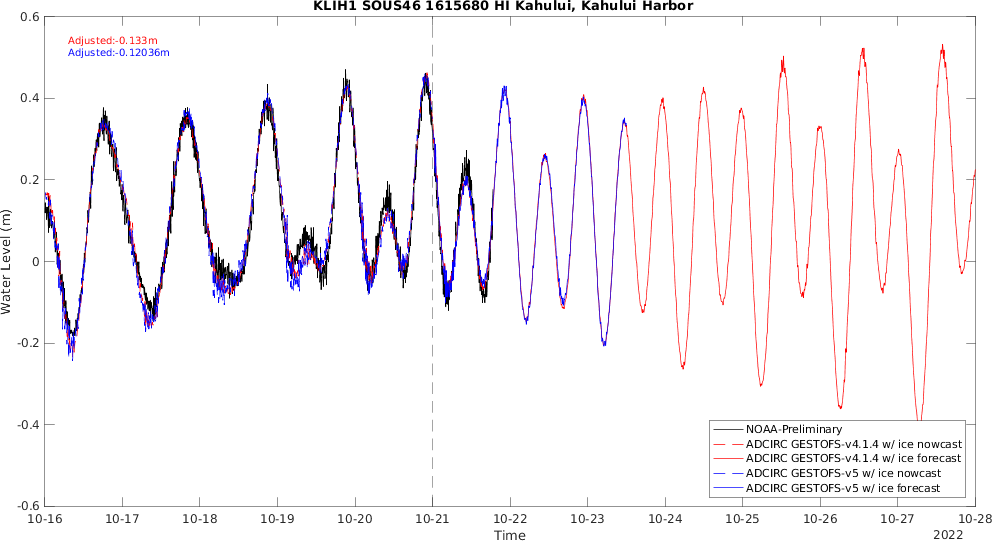
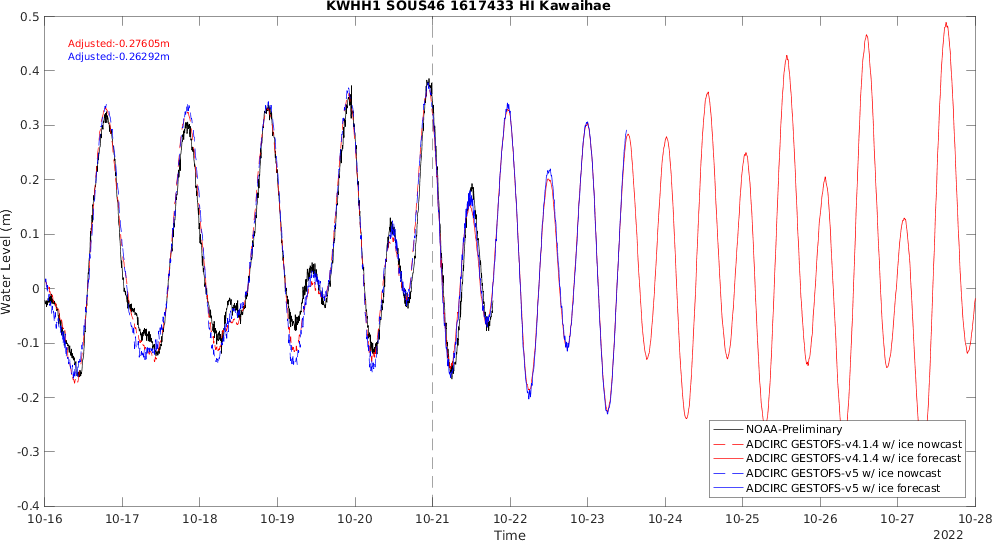
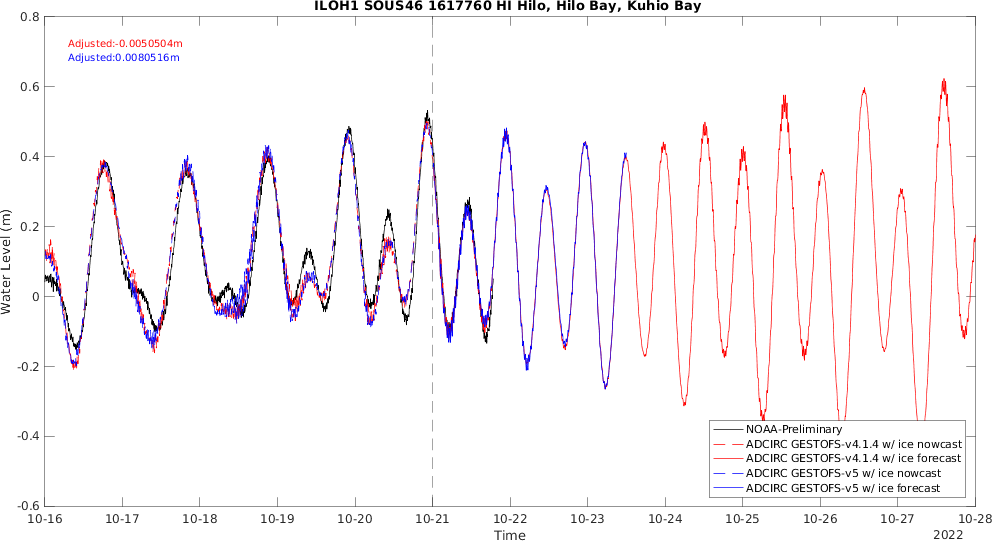
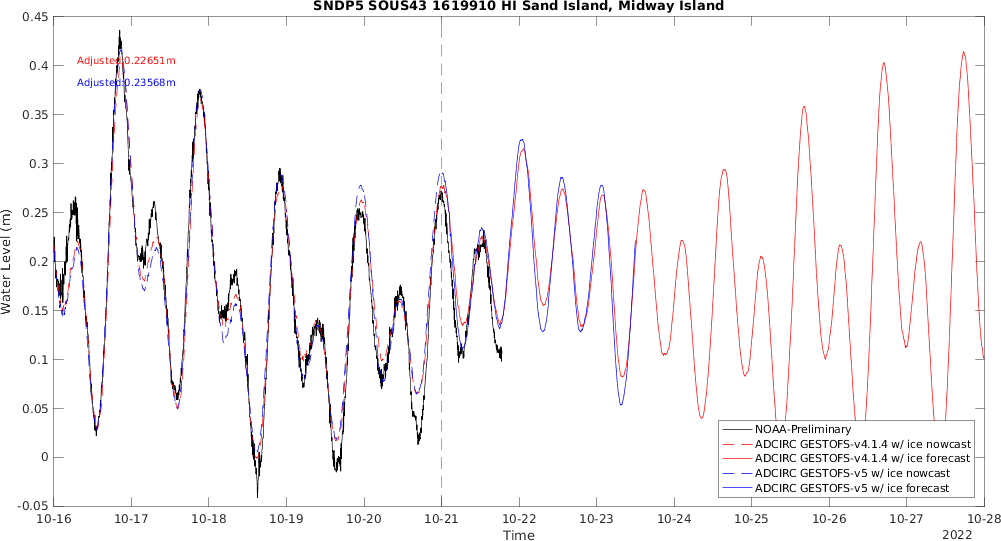
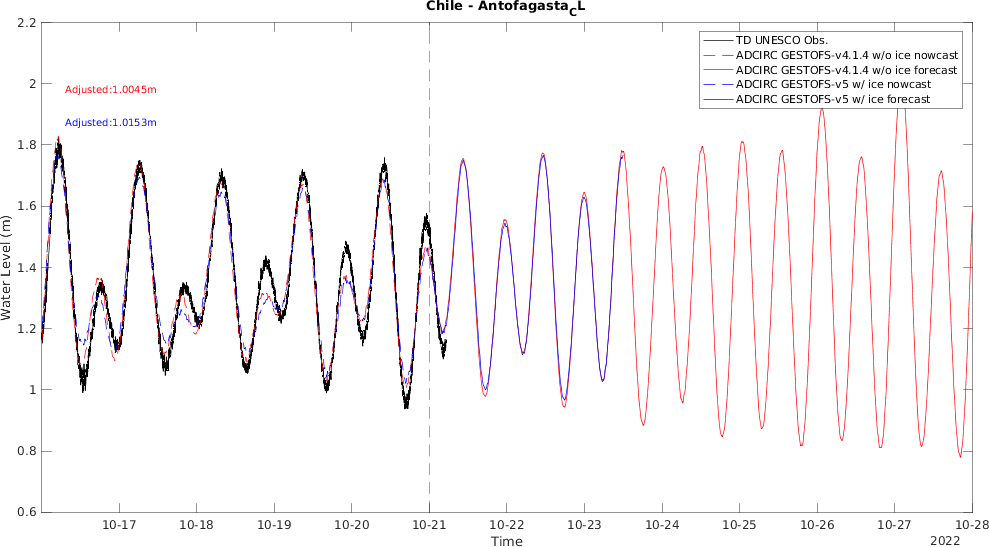
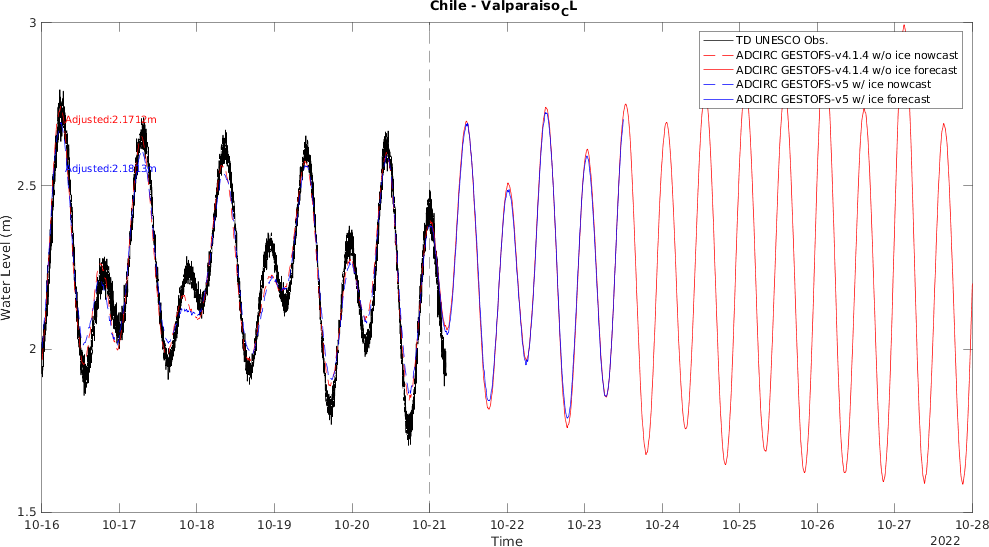
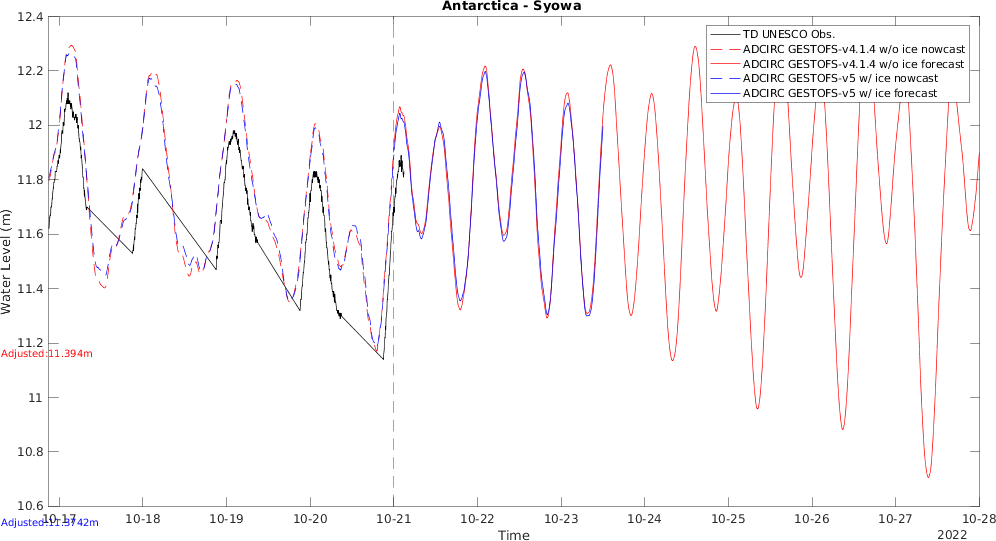
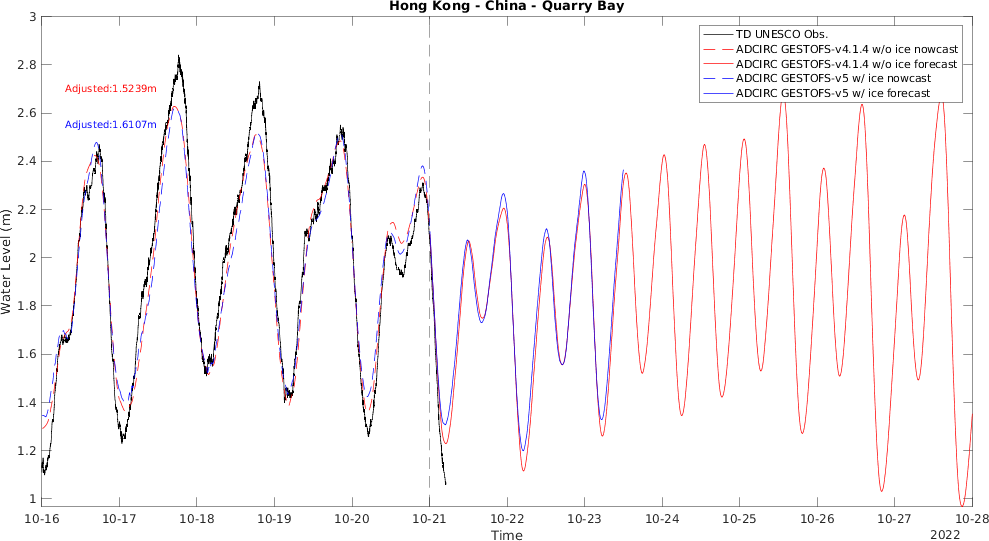
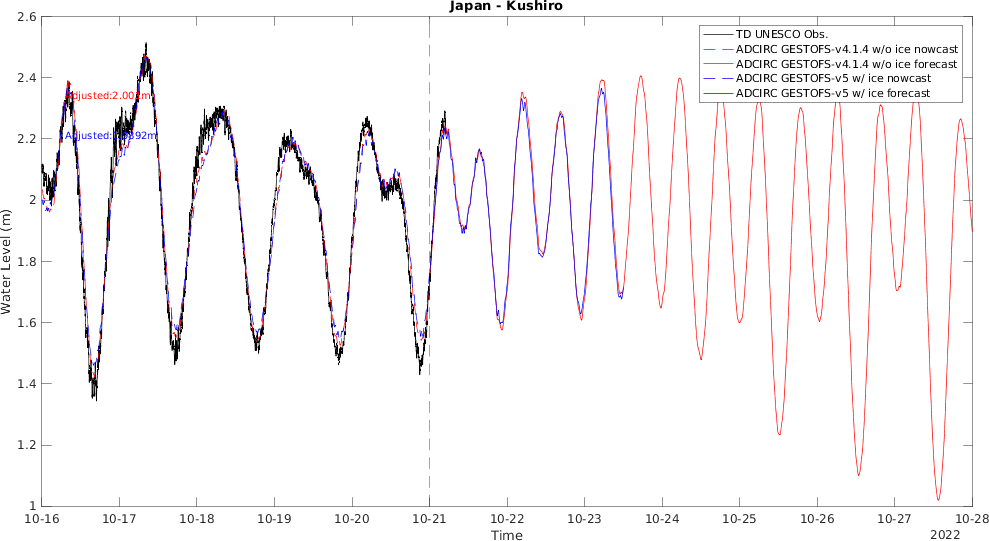
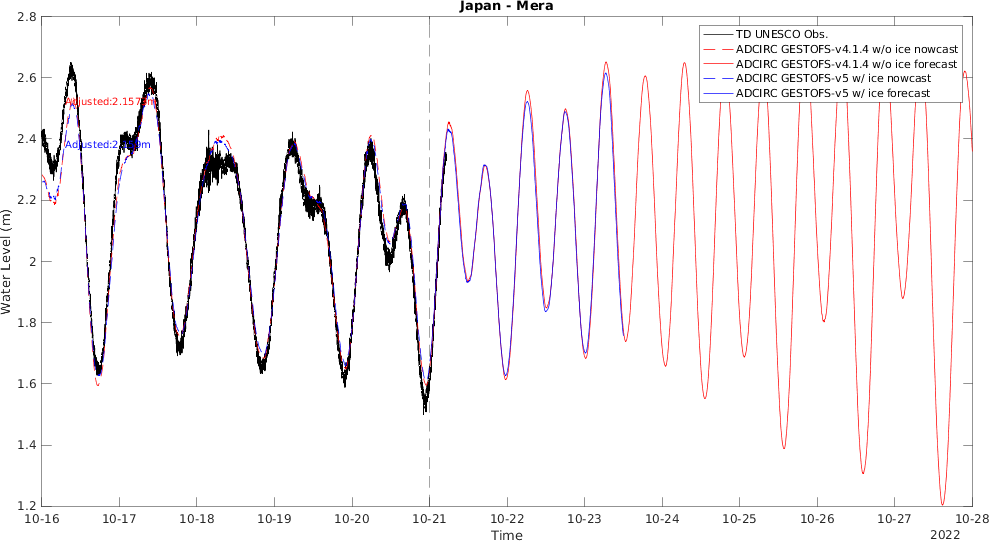
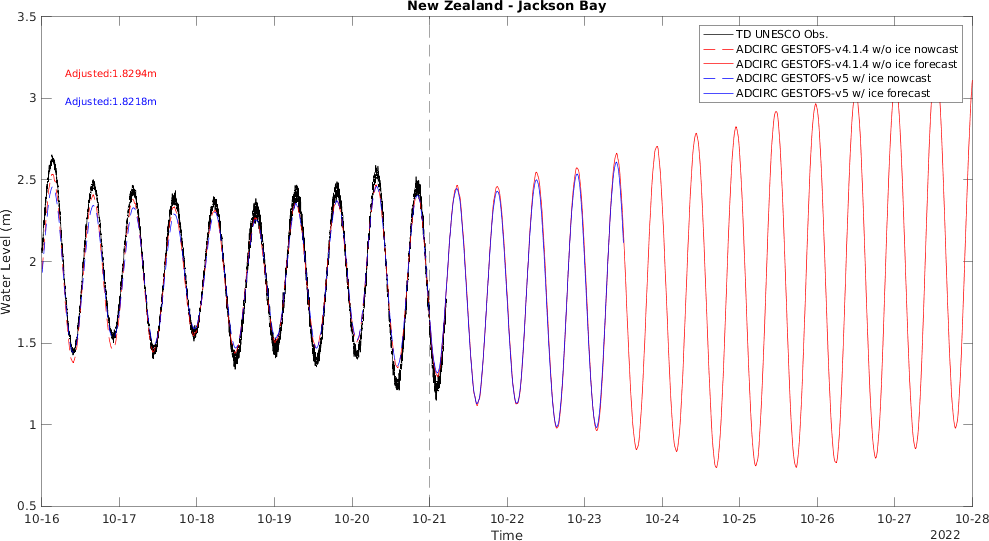
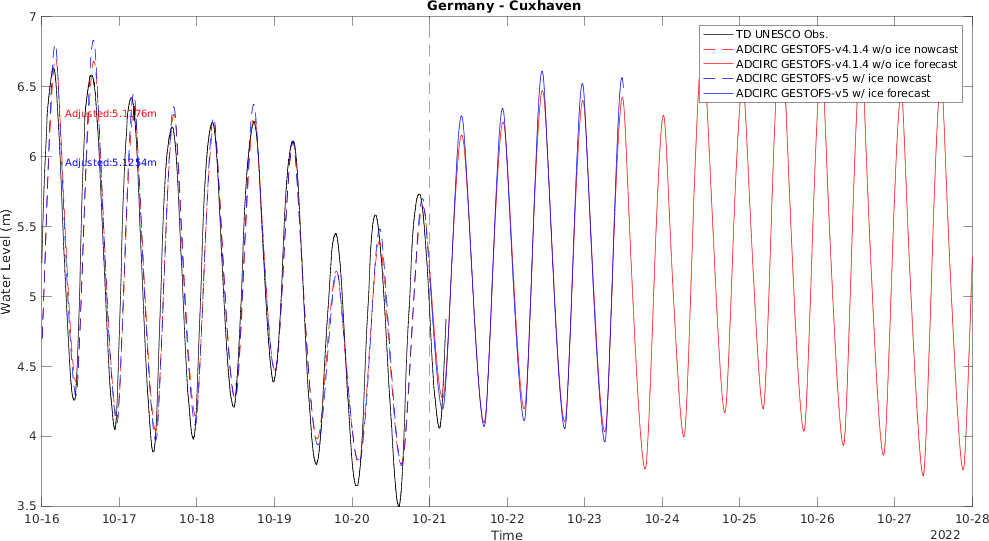
7. ADCIRC surface water elevation compared to stations
The forecast water level results are compared to the NOAA water level stations (green ones, https://tidesandcurrents.noaa.gov/stations.html?type=Water+Levels) and the water sea level gauges with the TD UNESCO database (yellow ones, https://webcritech.jrc.ec.europa.eu/SeaLevelsDb/Home). In the figures, the black line indicates the observational data, the dash red line indicates the nowcast results of the past 5 days and the solid red line indicates the following 7 day forecast results. The 'adj=xxm' means the adjustment of the mean sea level for the model results, and it is computed by subtracting the mean model nowcast results from the mean observational values.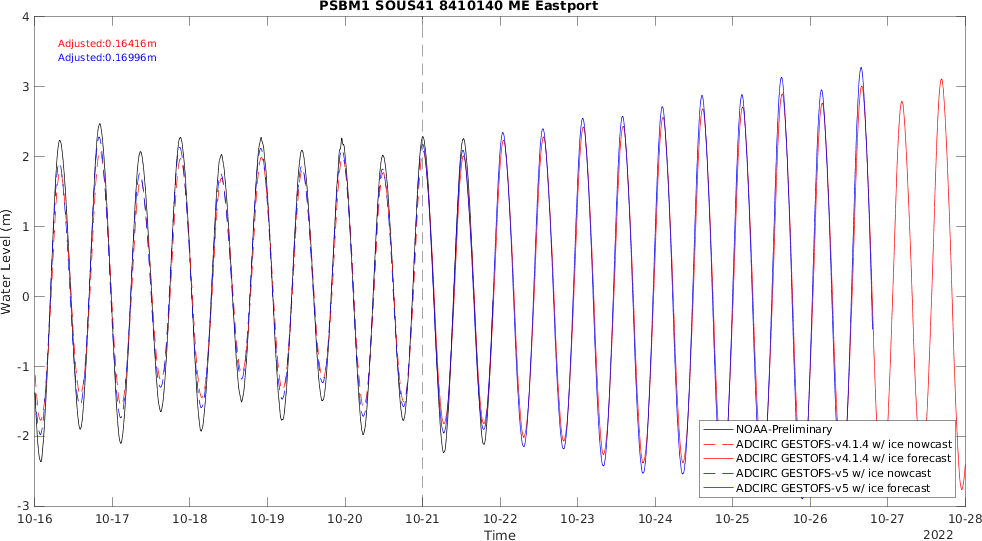


8. References
- W. Blier, S. Keefe, W.A. Shaffer and S.C. Kim: Storm Surges in the Region of Western Alaska, Monthly Weather Review, Vol.125, 1997.
- R.S. Chapman, S.C. Kim and D.J. Mark: Storm-Induced Water Level Prediction Study for the Western Coast of Alaska, ERDC/CHL Letter Report, 2009.
- ADCIRC: https://adcirc.org/.
- SWAN+ADCIRC: https://ccht.ccee.ncsu.edu/swanadcirc/.
- Brian R. Joyce, William J. Pringle, Damrongsak Wirasaet, Joannes J. Westerink, Andre J. Van der Westhuysen, Robert Grumbine, Jesse Feyenc: High resolution modeling of western Alaskan tides and storm surge under varying sea ice conditions, Ocean Modelling, Vol.141, 101421, 2019.
- Christof Lüpkes, Vladimir M. Gryanik, Jörg Hartmann, and Edgar L Andreas: A parametrization, based on sea ice morphology, of the neutral atmospheric drag coefficients for weather prediction and climate models, Journal of Geophysical Research, Vol.117, D13112, 2012.
- G. Ling, D. Wirasaet, J. Westerink, D. H. Richter, B. Joyce, W. Pringle, M. T. Contreras Vargas, K. R. Steffen, C. N. Dawson, A. Fujisaki-Manome, E. Myers, S. Moghimi, S. V. Vinogradov, A. Van der Westhuysen, A. Abdolali, and R. Grumbine: Studies on Parameterizations of Sea Ice Effect in a Storm Surge Model for Western Alaska,
https://ams.confex.com/ams/2020Annual/webprogram/Paper370912.html, AMS, 2020.
- C.O. Collins and W.E. Rogers, A Source Term for Wave Attenuation by Sea ice in WAVEWATCH III ®: IC4, NRL Report NRL/MR/7320--17-9726, 2017.
- M.H. Meylan, L.G. Bennette and A.L. Kohout: In situ measurements and analysis of ocean waves in the Antarcticmarginal ice zone, Geophysical Research Letters, Vol.41(14), pp. 5046–5051, 2014.
- GLOCOFFS (GLObal Coastal Ocean Flood Forecasting System): https://wpringle.github.io/GLOCOFFS/.