Alaska Coastal Ocean Forecast System - Regional (ALCOFS-R)
DISCLAIMER: This model is under experimental development. The results should not be used for navigational purposes or emergency planning under any circumstances. Please do not duplicate and use the result figures from this website without permission.
UPDATES
- Updated on 01-15-2021: Due to the computer maintenance from Jan. 15 to 17, during this period the forecast results will not be updated.
- Updated on 09-13-2020: A global forecast wave model using WW3 with IC4M2-IS1 is published on the section 8.
- Updated on 09-01-2020: Updated for using 1 hourly wind, pressure, ice forcing, previsouly using 3 hourly, and restarted SWAN+ADCIRC.
- Updated on 08-25-2020: Updated for adding the significant wave height forecast by using SWAN+ADCIRC with the IC4M2 method in SWAN.
- Updated on 08-07-2020: Updated to Version 2, daily forecast simulations just include 1 day hindcast and 5 day forecast.
- Updated on 06-13-2020: Updated the bathymetry by using GEBCO2020.
- Updated on 06-10-2020: ADCIRC Ver.55 is applied.
- Established on 04-28-2020: Testing Version 1, hindcast for 13 days and forecast for 5 days every day.
NOTES
The forecast system runs once a day, starts from 00:30, ends in around 07:00. The forecast animations are uploaded at 08:00, the water level figures are updated at 06:00, 12:00, 15:00, 18:00 for comparing with the latest observational data from NOAA stations. The time showing in the figures are in UTC.
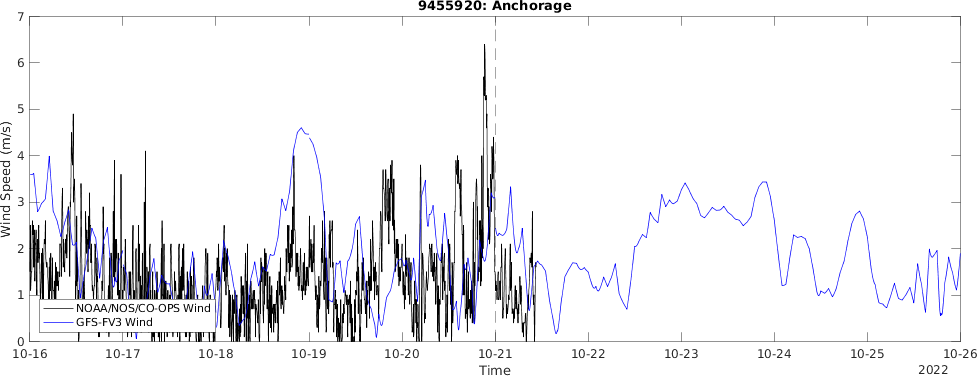
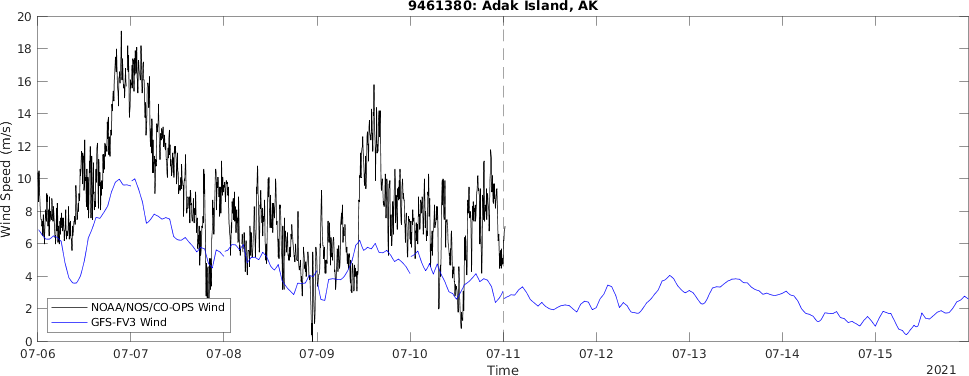
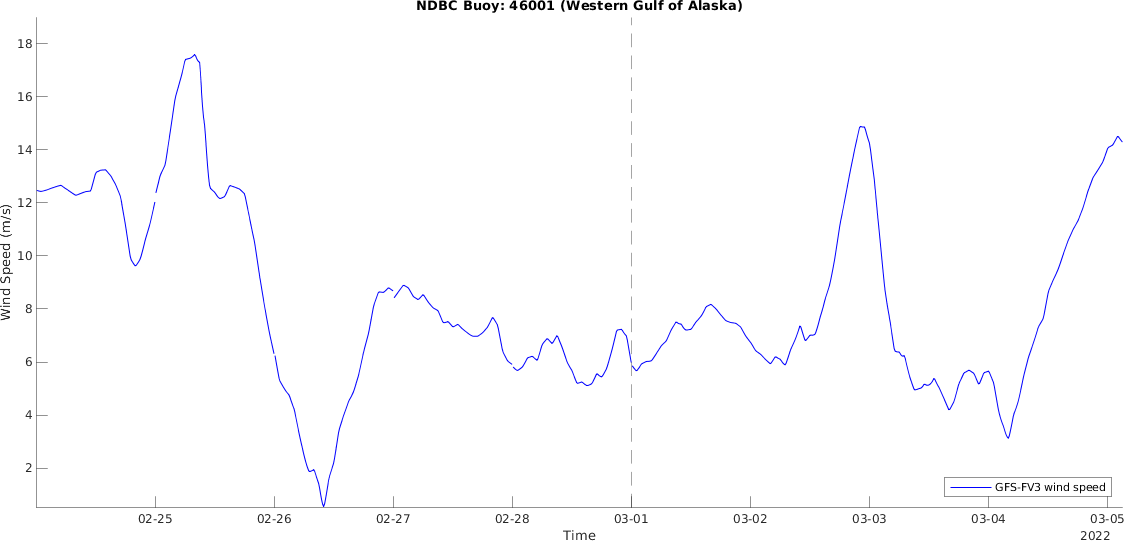
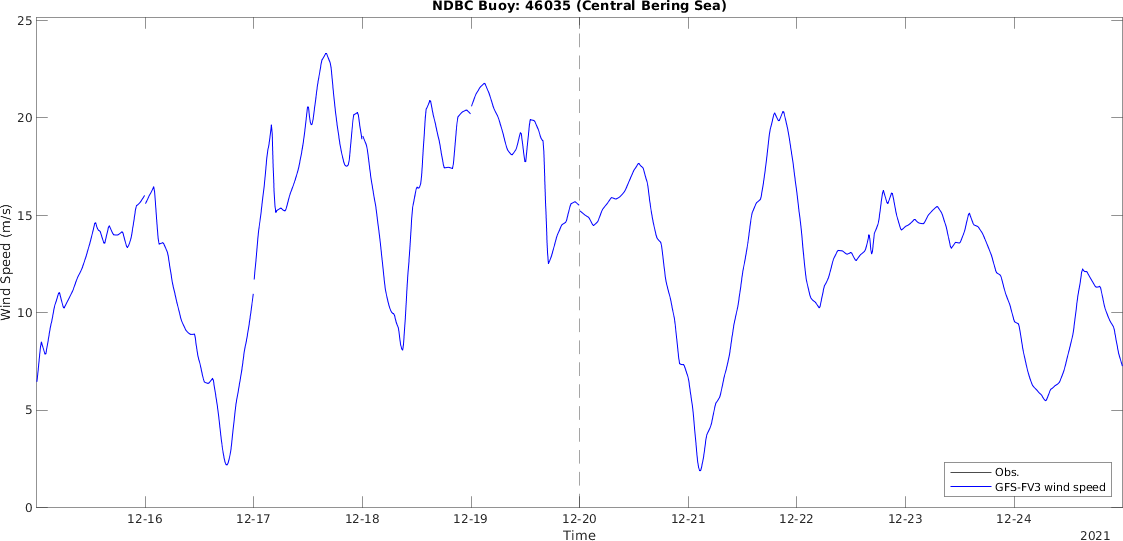
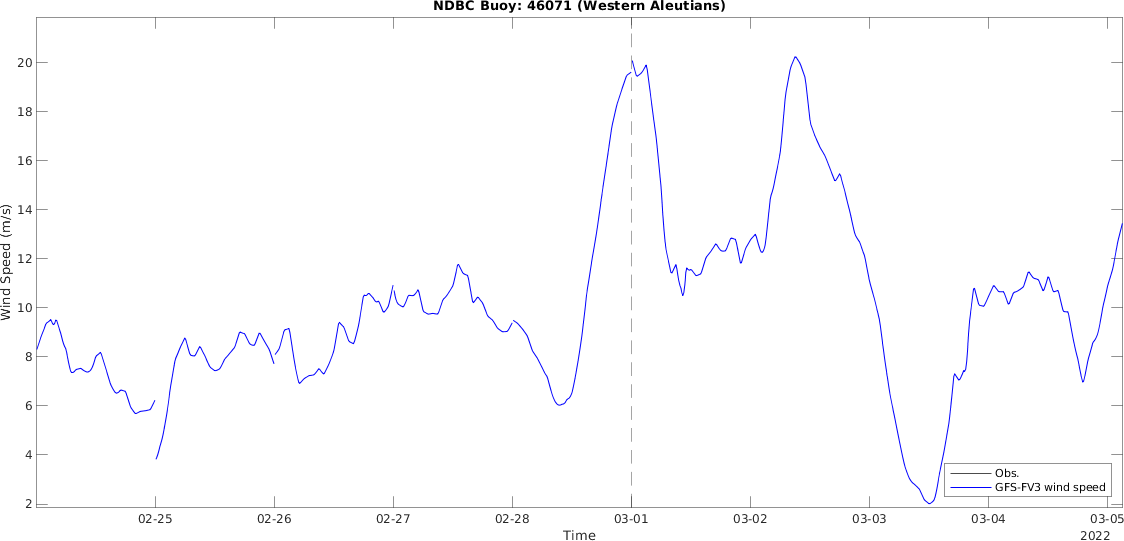
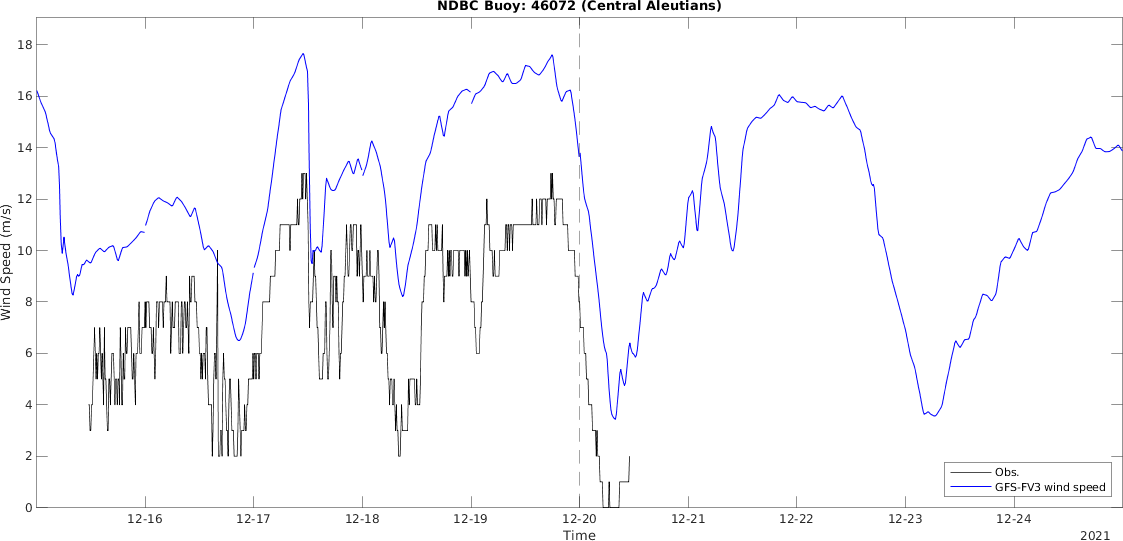
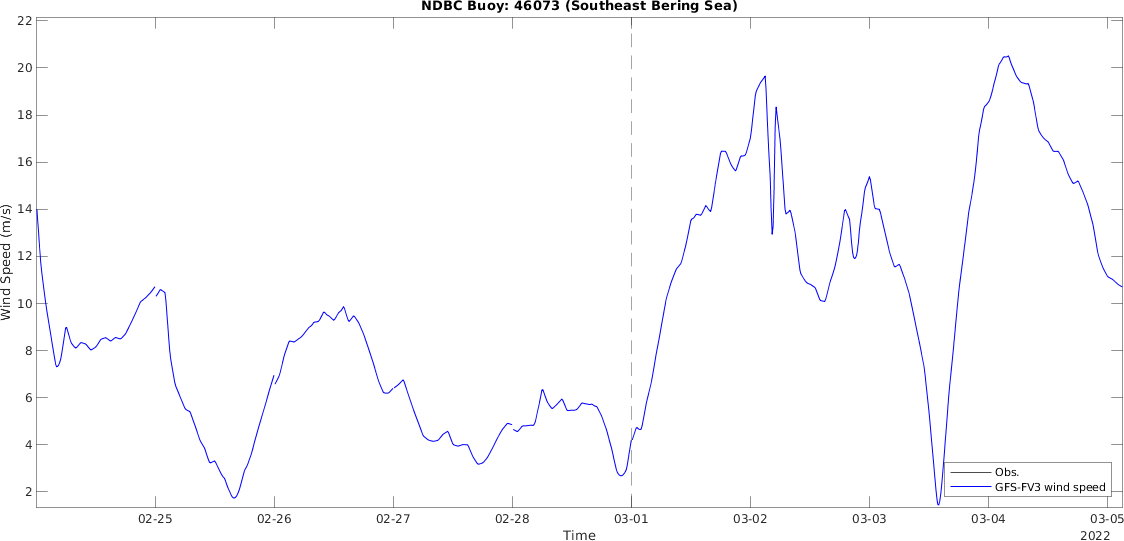
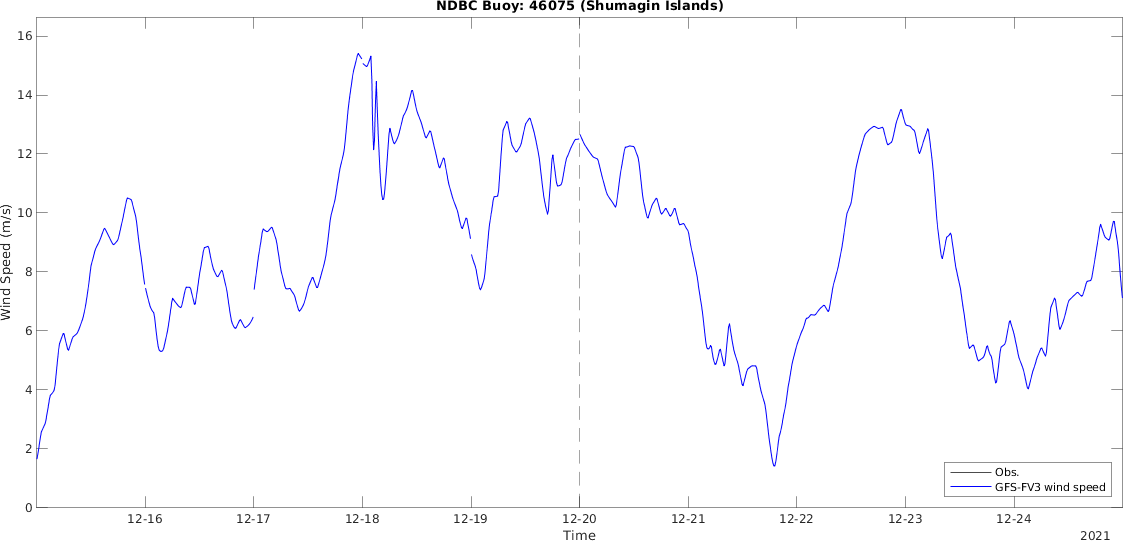
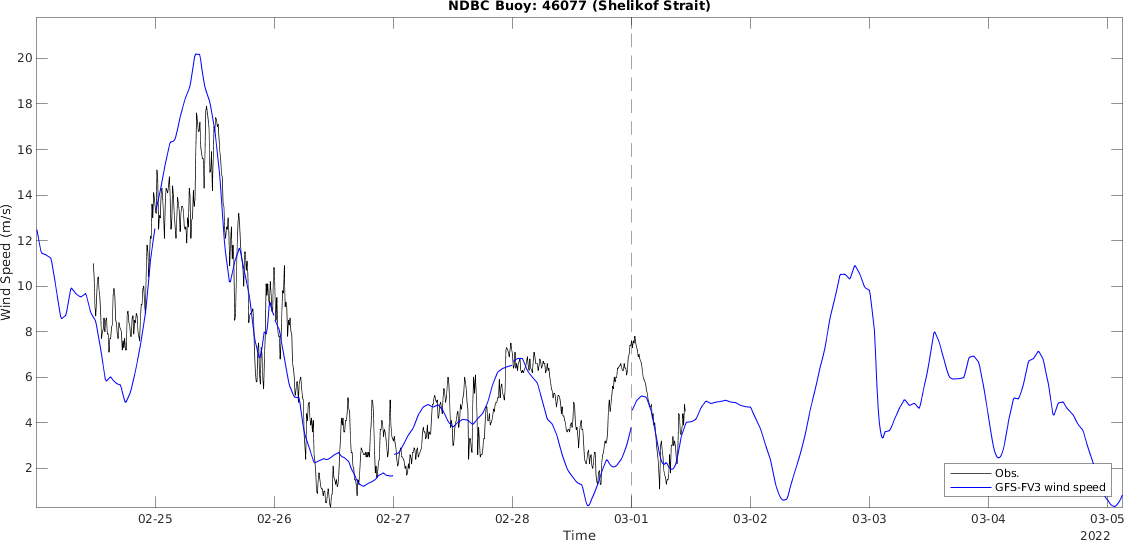
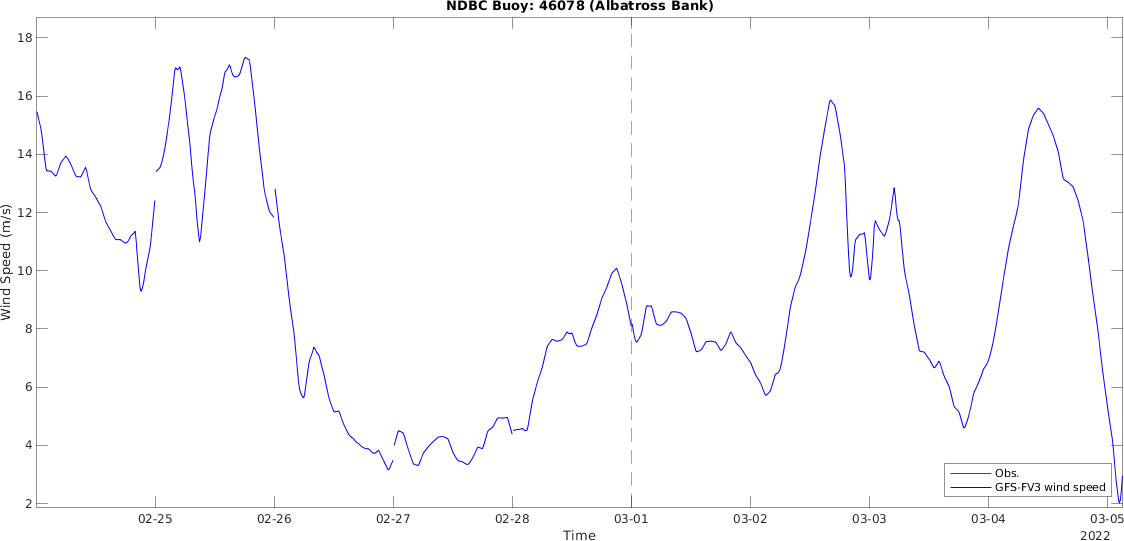
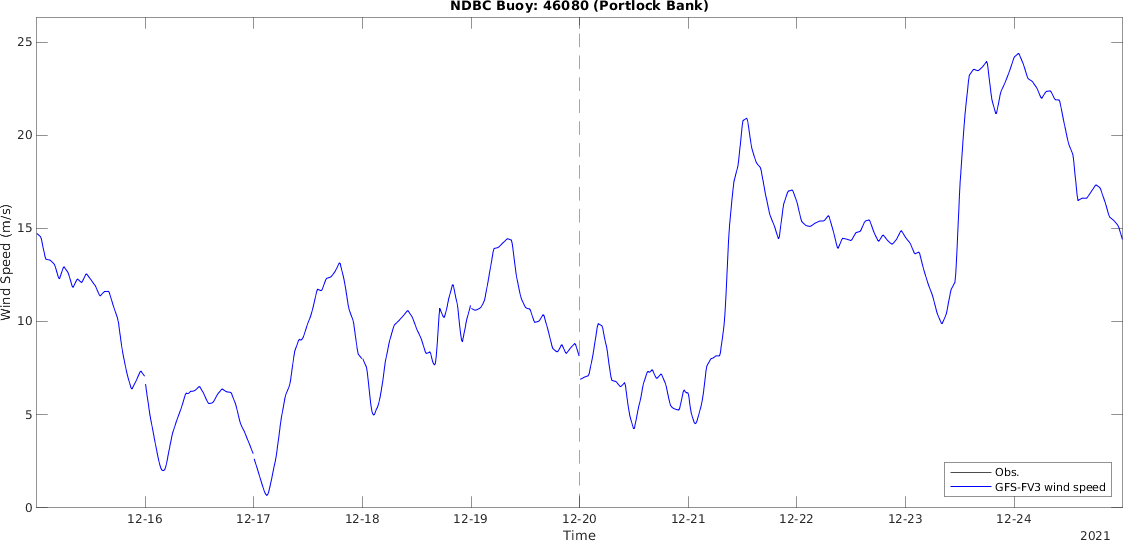
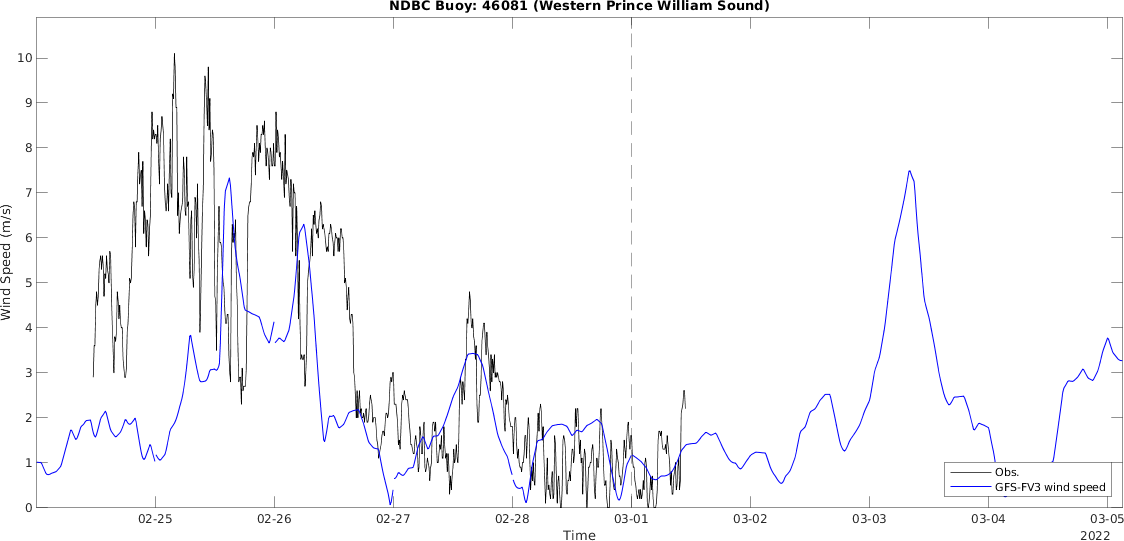
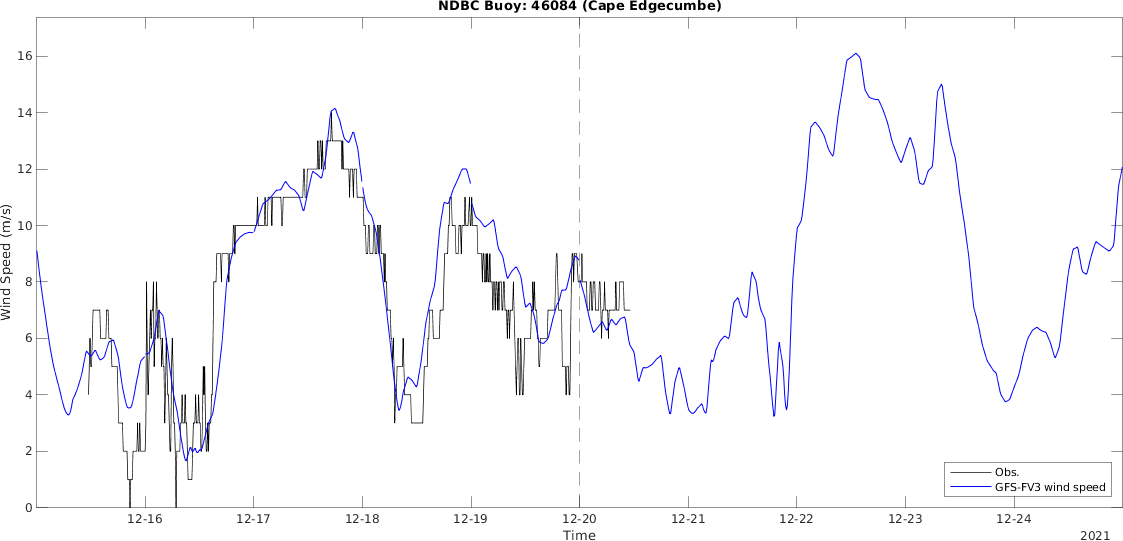
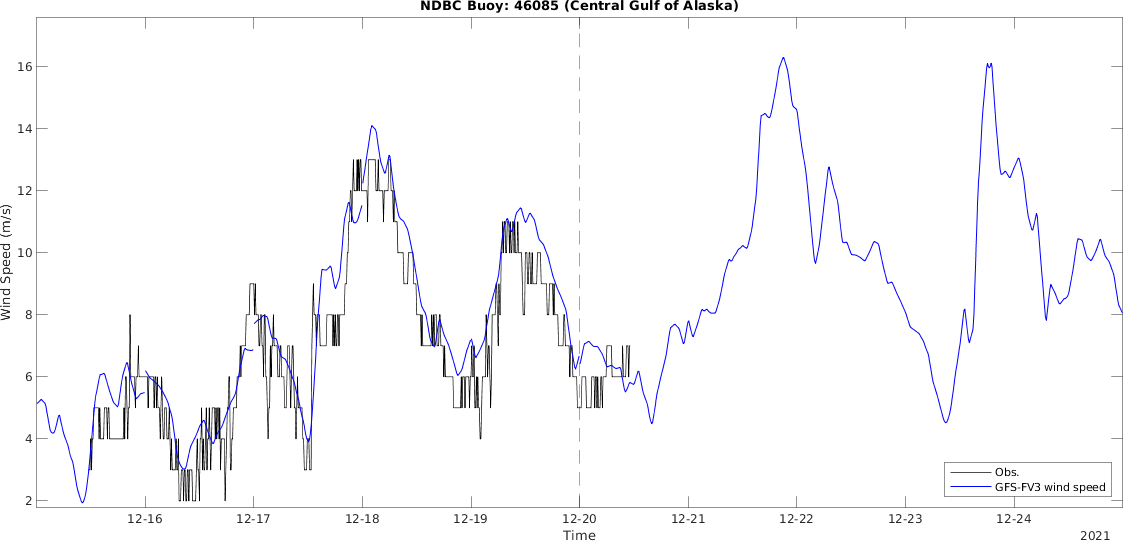
1. GFS-FV3 wind speed (5 day forecast)
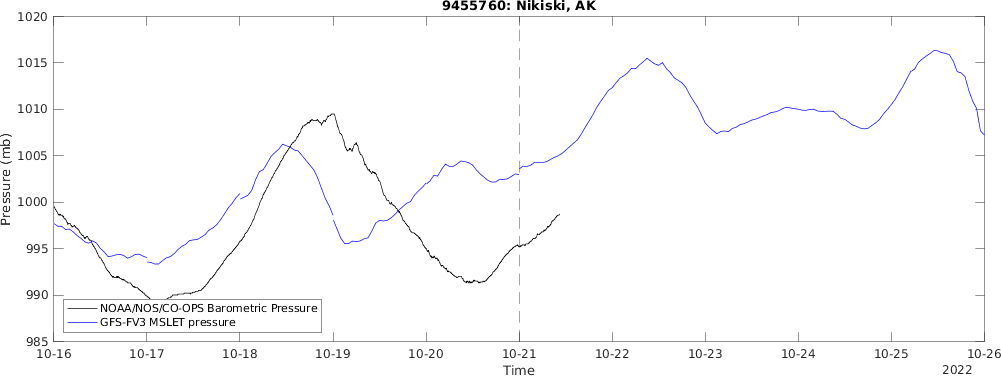
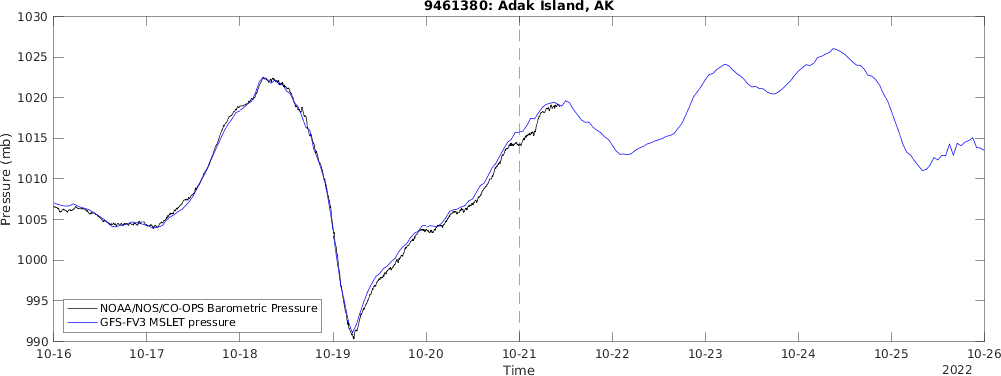
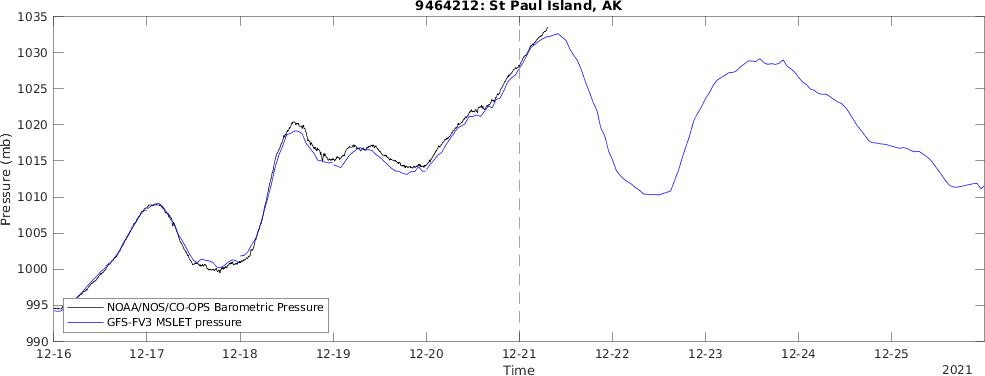
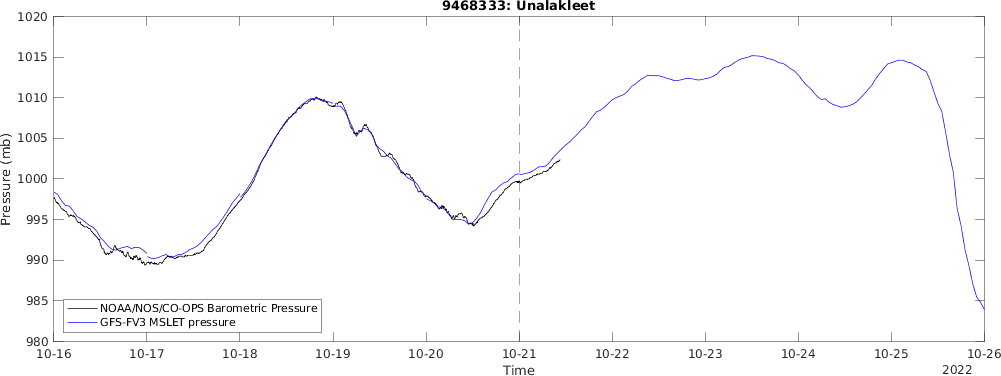
2. GFS-FV3 atmospheric pressure (MSLET, Mean Sea Level Pressure) (5 day forecast)
3. GFS-FV3 ice concentration (5 days forecast)
4. ADCIRC surface water elevation (5 day forecast)
Animation, 2 hourly output. The simulation result in the animation apply ADCIRC with ice parameterization.
The following animation is an enlarged view for the surface elevation and wind speed vectors. The figures for this animation were generated by FigureGen v.49.
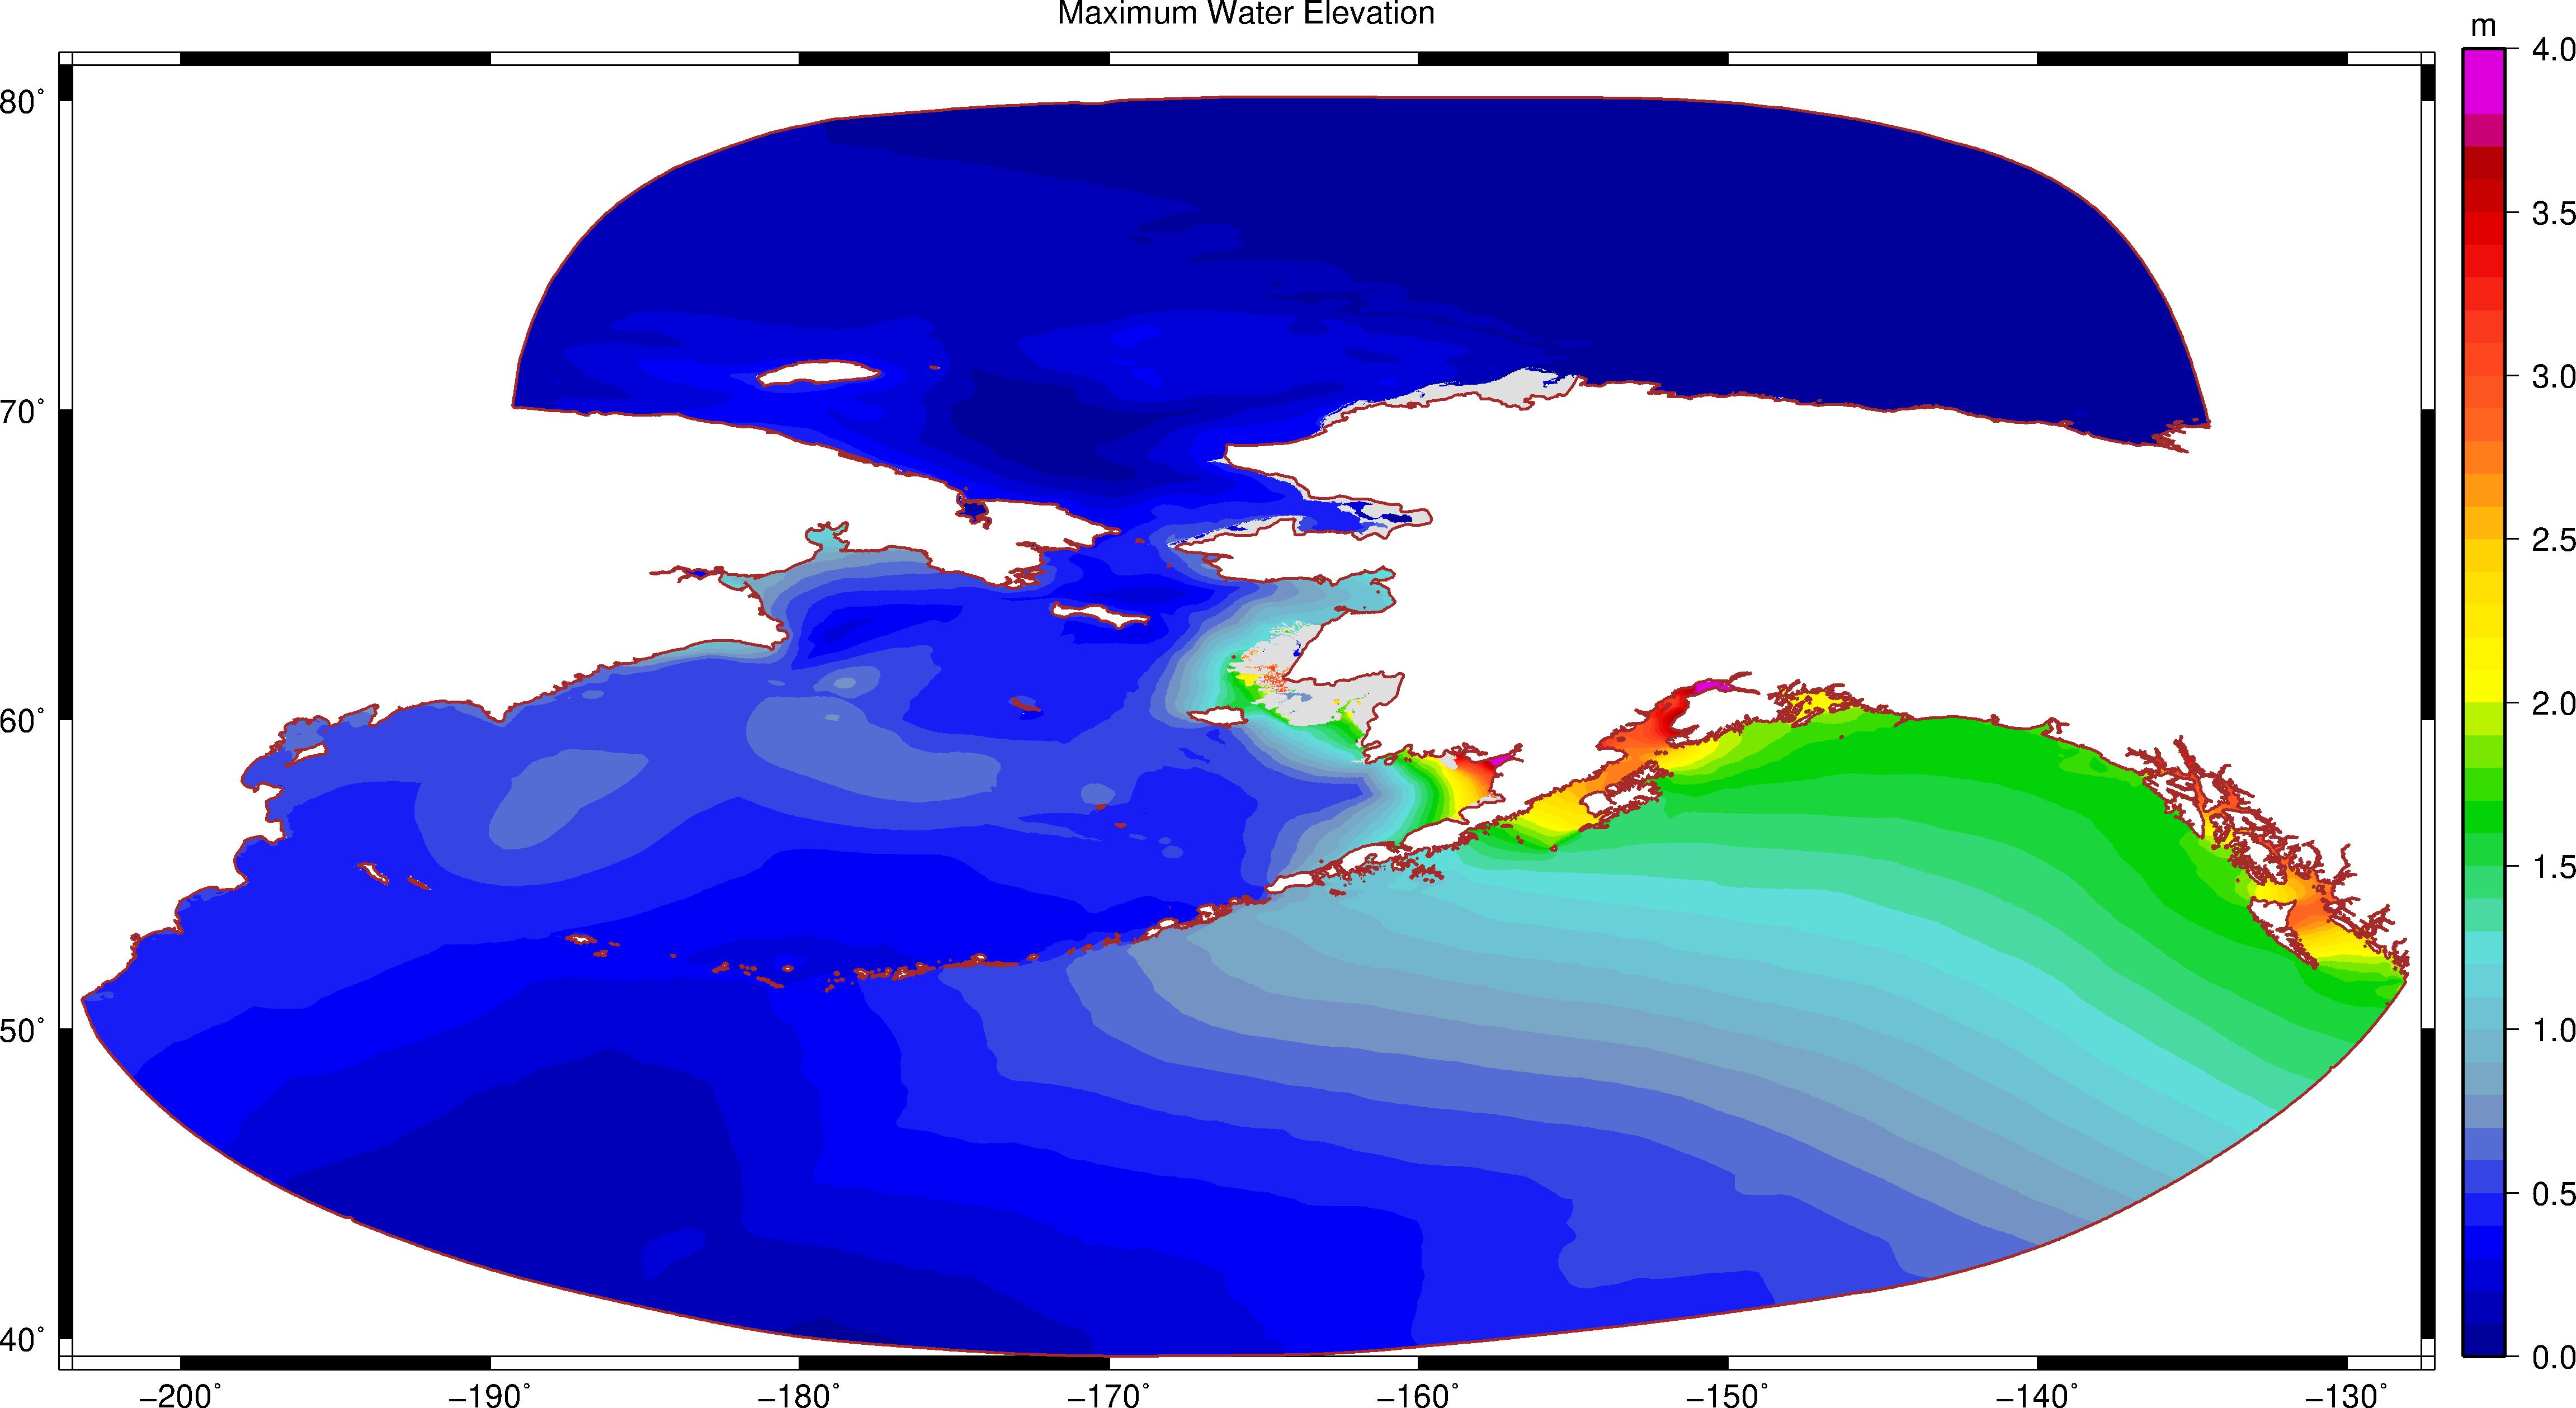
5. Maximum ADCIRC surface elevation for the 5 day forecast period
Zoom in by clicking the following locations:
・Whole Domain・Western Alaska・Cook Inlet・Northern Alaska・Inside Passage
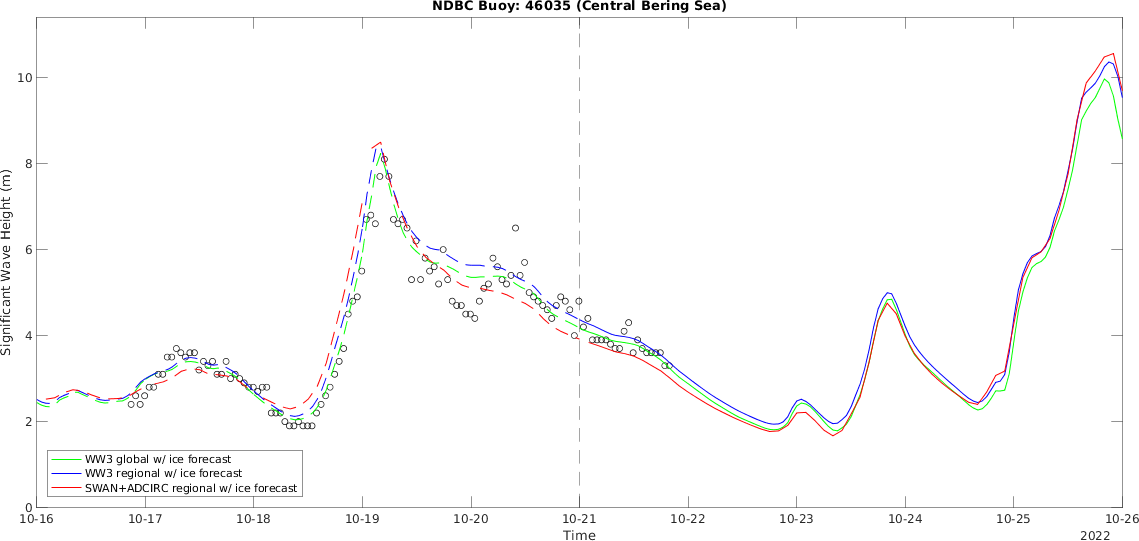
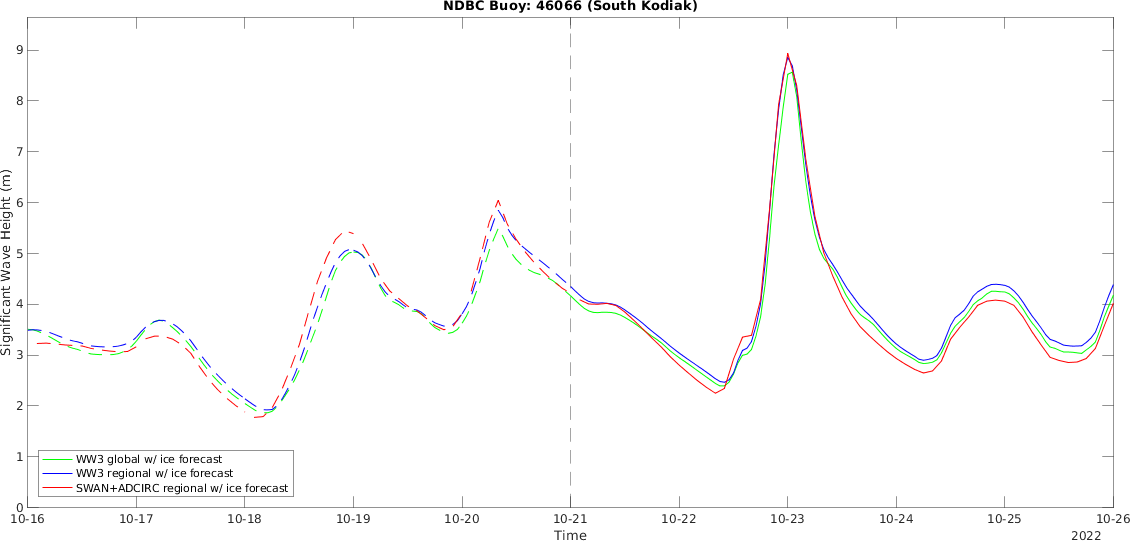
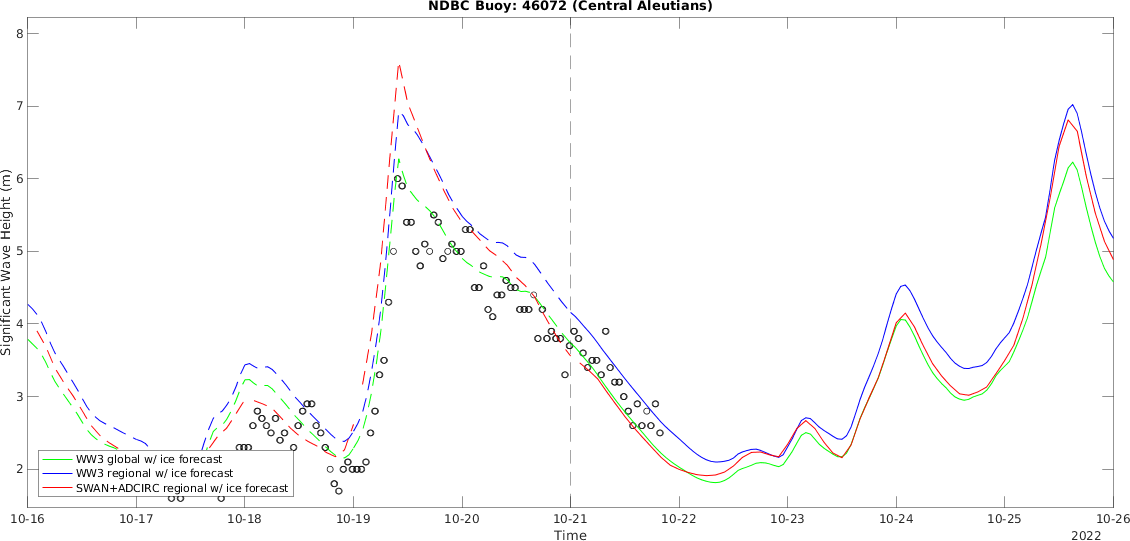
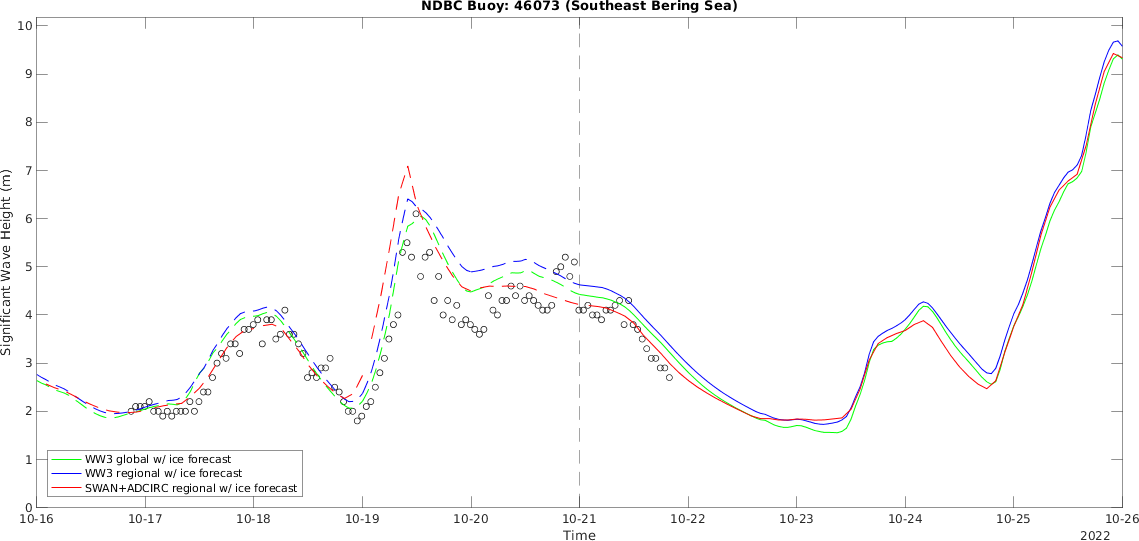
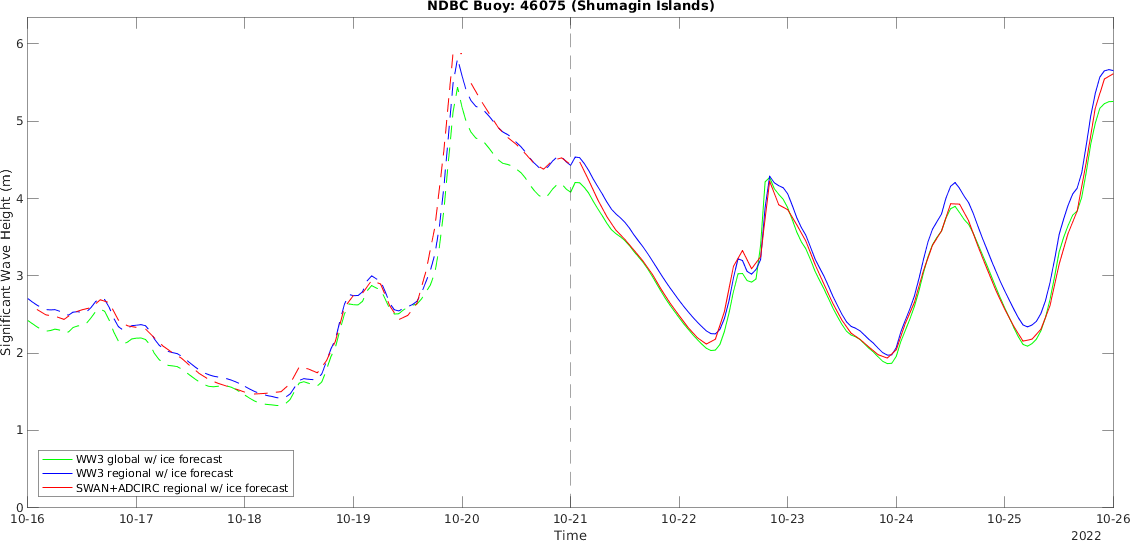
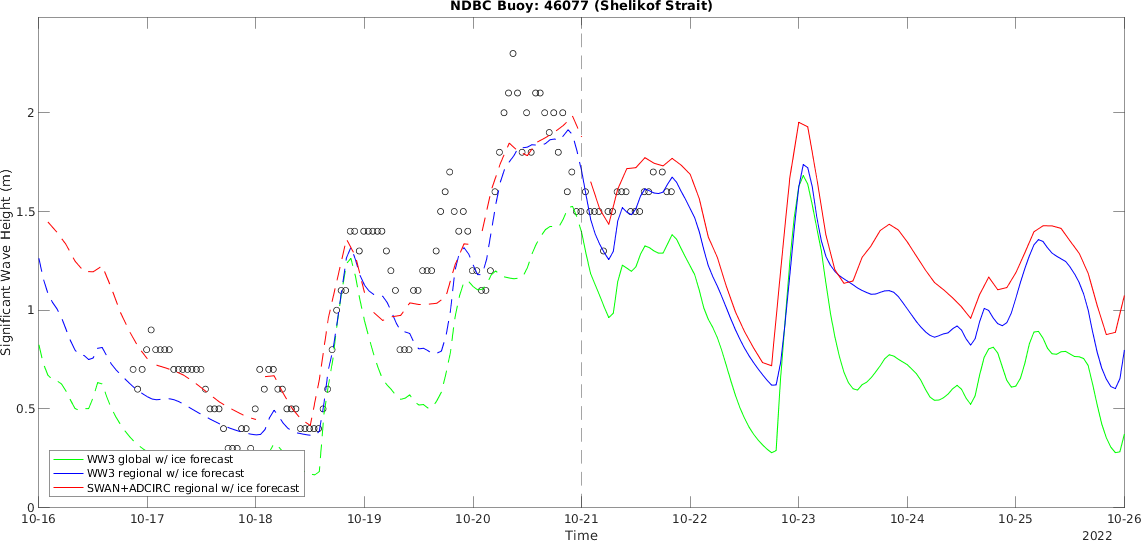
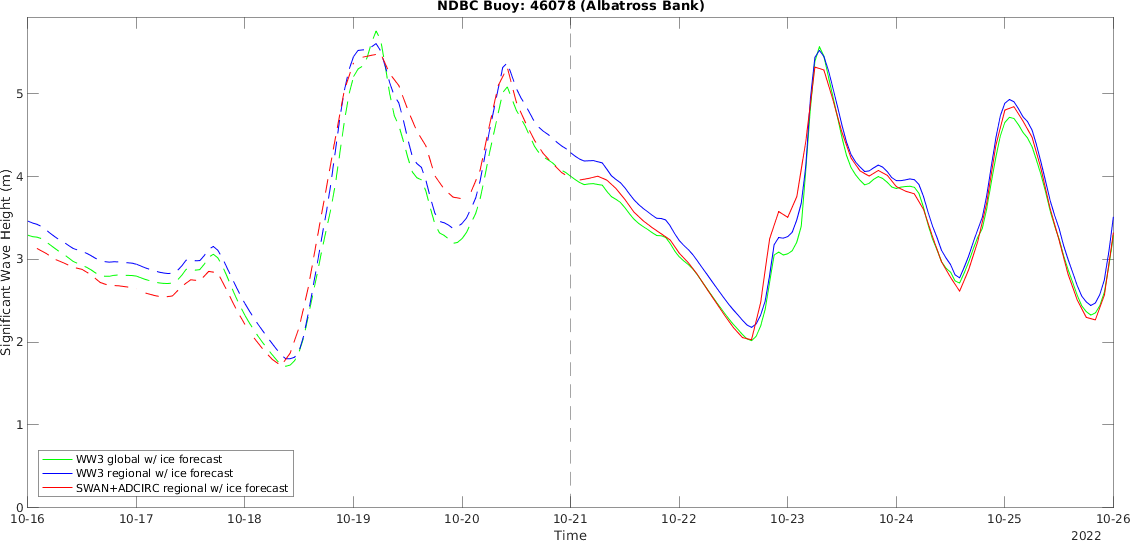
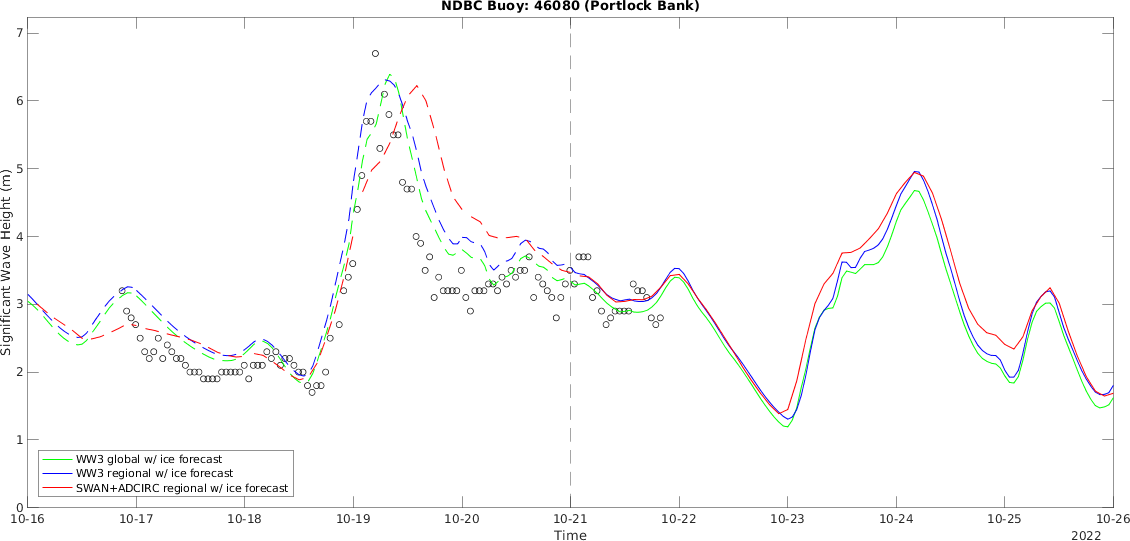
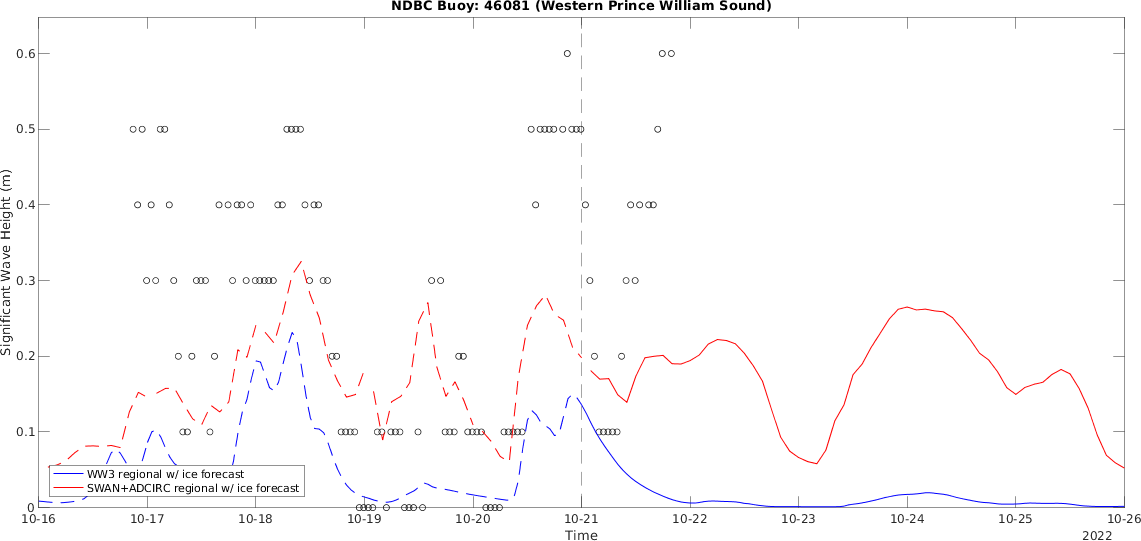
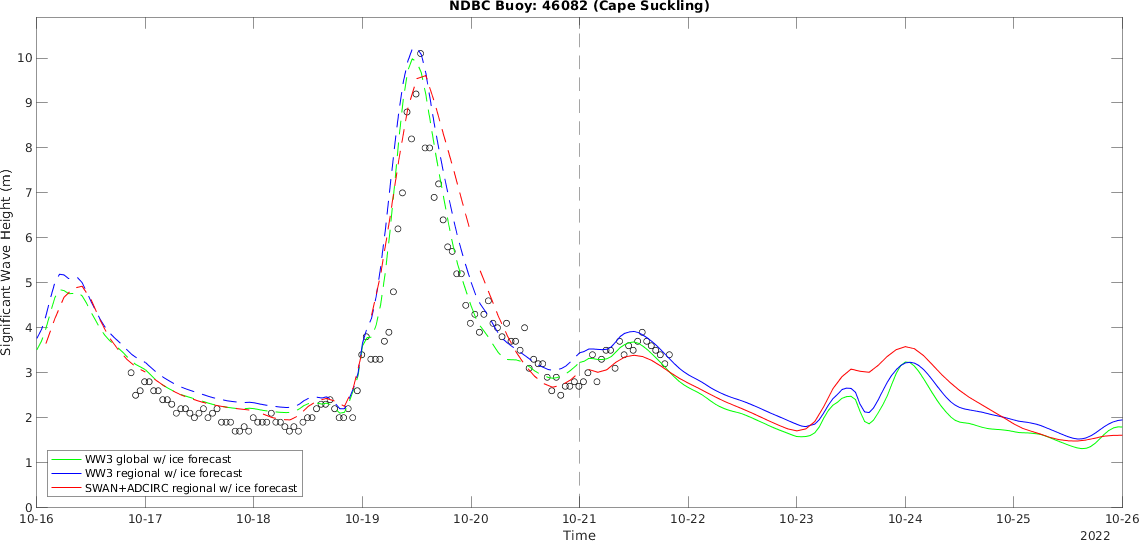
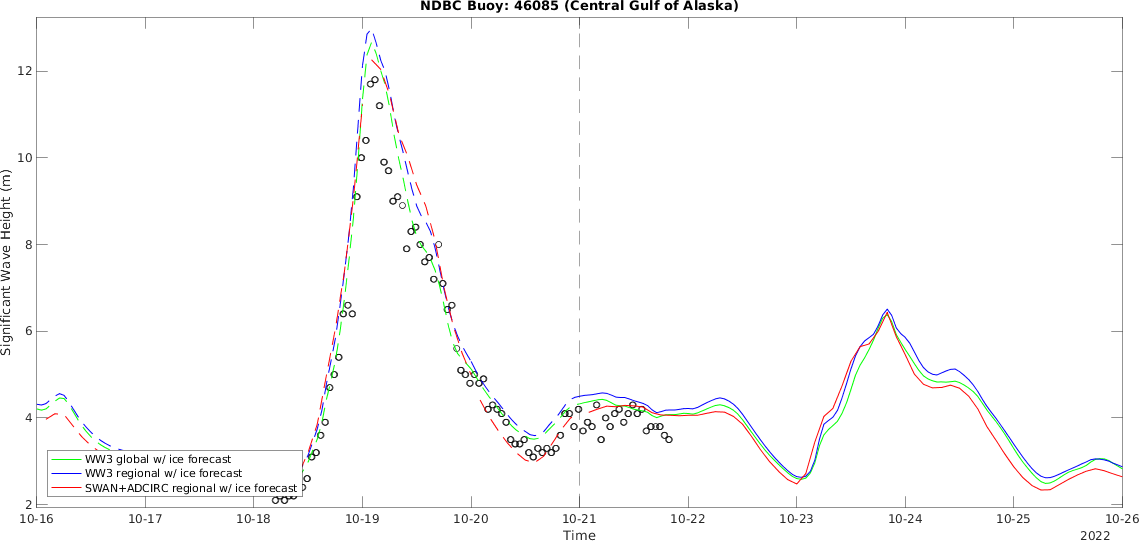
6. SWAN+ADCIRC significant wave height (5 day forecast)
The IC4M2 method (Collins and Rogers, 2017) is utilized in SWAN for activating a source term Sice to represent the dissipation of wave energy by sea ice. Some parameters setting for SWAN: time interval=3600s, MDC=36(number of meshes in θ-space), MSC=40(one less than the number of frequencies). For the IC4M2 parameter, we use C2=1.06e-3, C4=2.30e-2 according to Meylan et al. (2014), which is for the case of ice floes, mostly 10 to 25 m in diameter, in the marginal ice zone near Antarctica. (Further consideration may need to be done in the future work since we are handling different ice zone)
7. SWAN+ADCIRC radiation stress gradient (5 day forecast)
8. WW3 significant wave height (5 day forecast)
This is a 5 day global wave forecast results by using WAVEWATCH III (WW3) with GFS-FV3 wind and ice forcing. In this global model, 0.25 degree structured grid (longitude: 0-360; latitude: -90-80.25) is generated by using gridgen, and the bathymetry is interpolated from GEBCO2020. WW3 model setup: PR3, LN1, NL1, BT1, DB1, MLIM, ST4, FL0, STAB0, UQ, IC4, IS1, REF0 (refered to https://polar.ncep.noaa.gov/waves/hindcasts/nopp-phase2.php, but here we applied the IC4M2 and IS1 to consider the sea ice effects). The purpose for this global forecasting model are to provide wave boundary conditions to the high resolution regional model, and to provide an image of the 5 day forecast global significant wave height.Enlarged views are provided by clicking the following locations:
・Alaska・East Coast of the US・CJ
 The following 5 day forecast result of significant wave height is using the operational high resolution unstructured mesh and the WW3,
the open ocean boundary wave conditions were forced from the global operational model.
The following 5 day forecast result of significant wave height is using the operational high resolution unstructured mesh and the WW3,
the open ocean boundary wave conditions were forced from the global operational model.
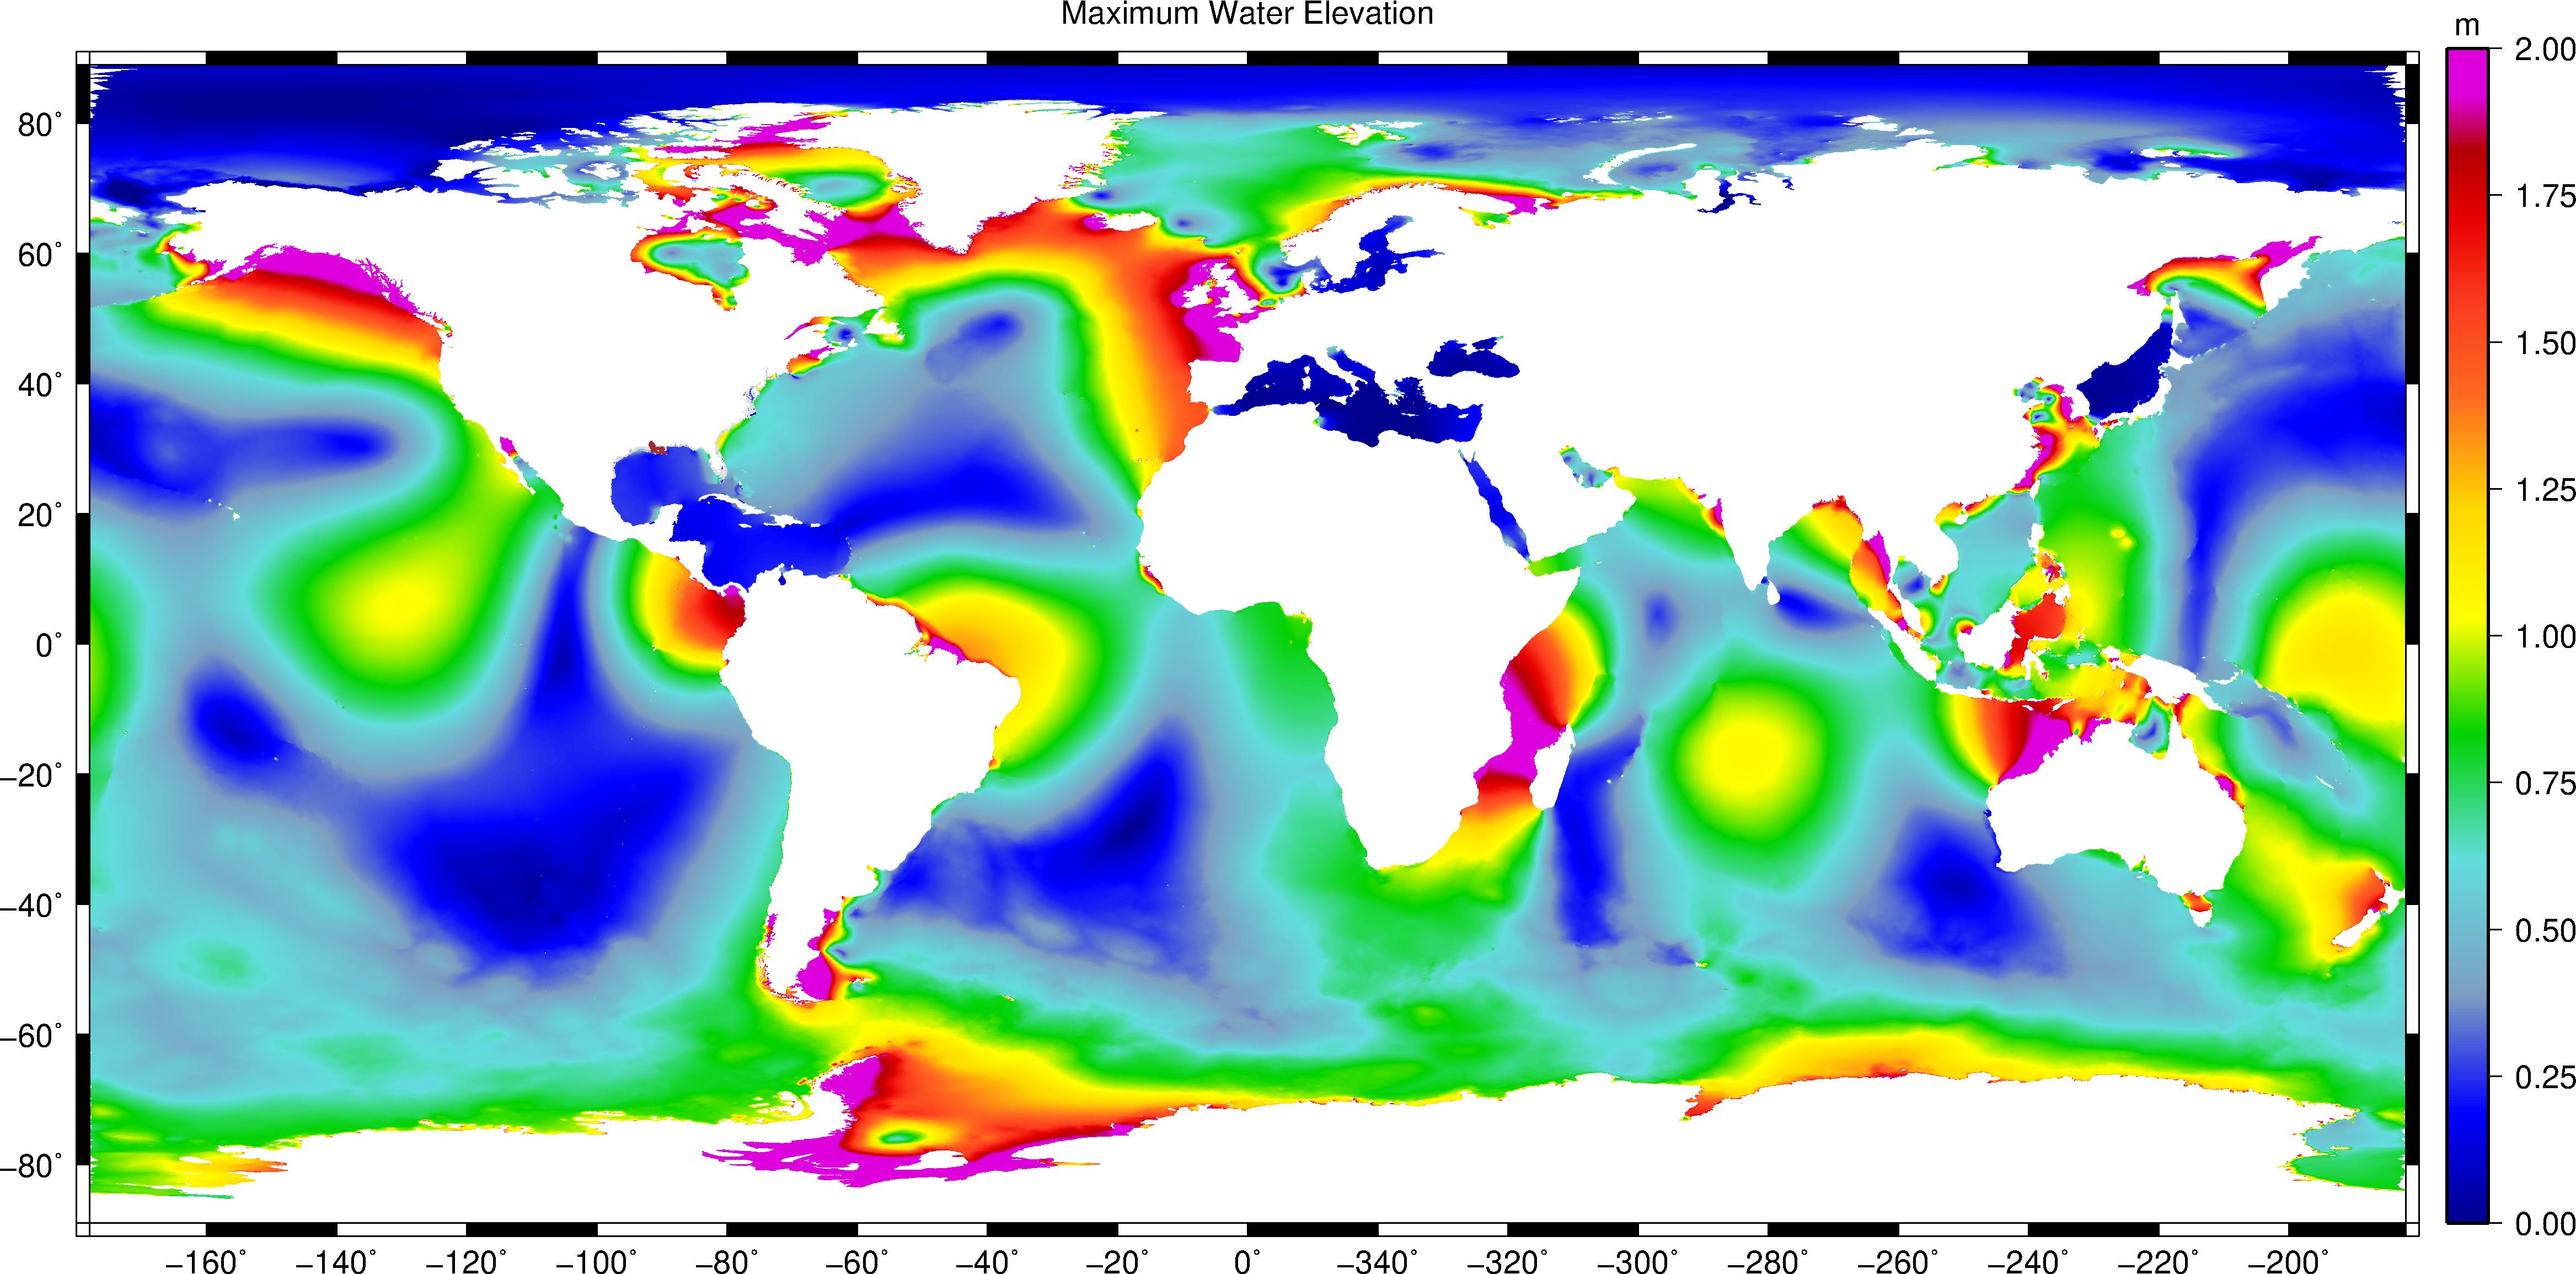
9. Global GFS-FV3 wind speed, Global ADICIRC surface water elevation (5 day forecast) and maximum surface elevation for the 5 day forecast period
Global finite element mesh(GESTOFS v4.1.4 model, the same global model using at https://cera.coastalrisk.live): 8,452,486 nodes, 16,226,163 elements; compuational time step: 12s; computational wallclock time: about 2h30min by using 240 cores for 5 day forecast.
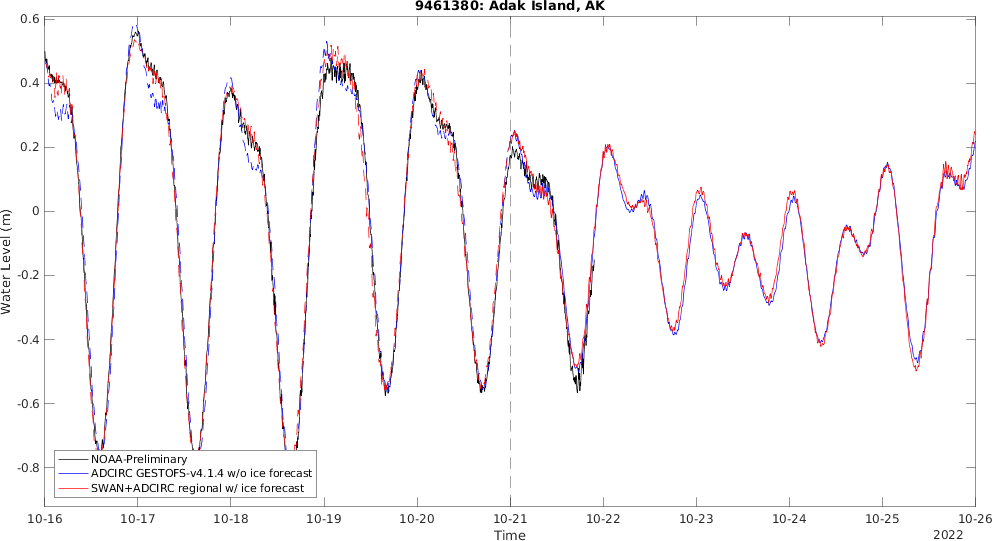
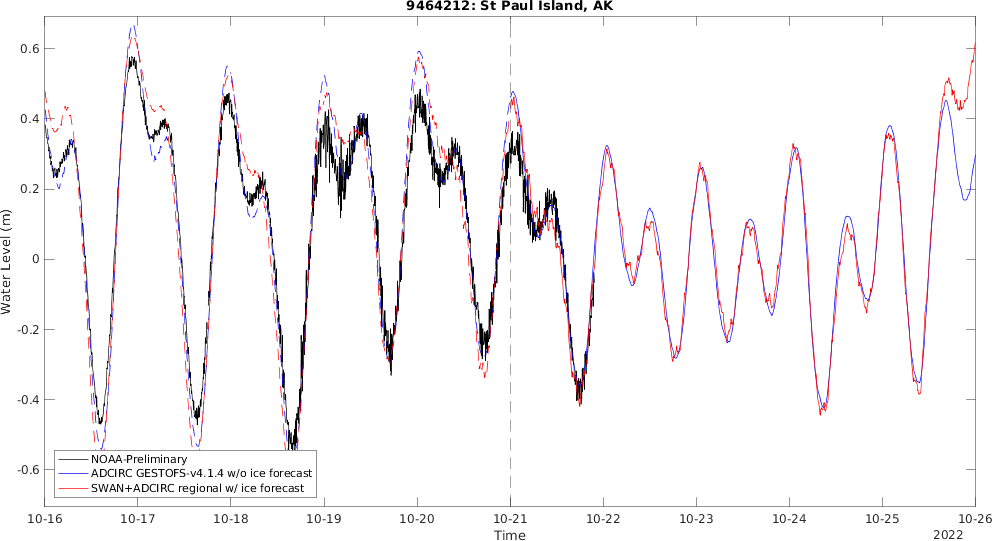
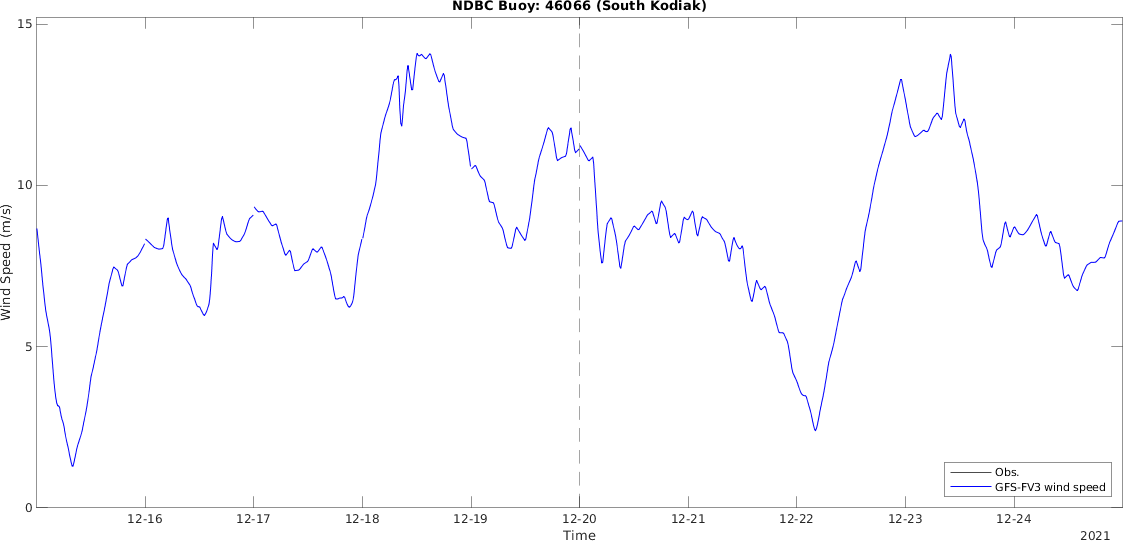
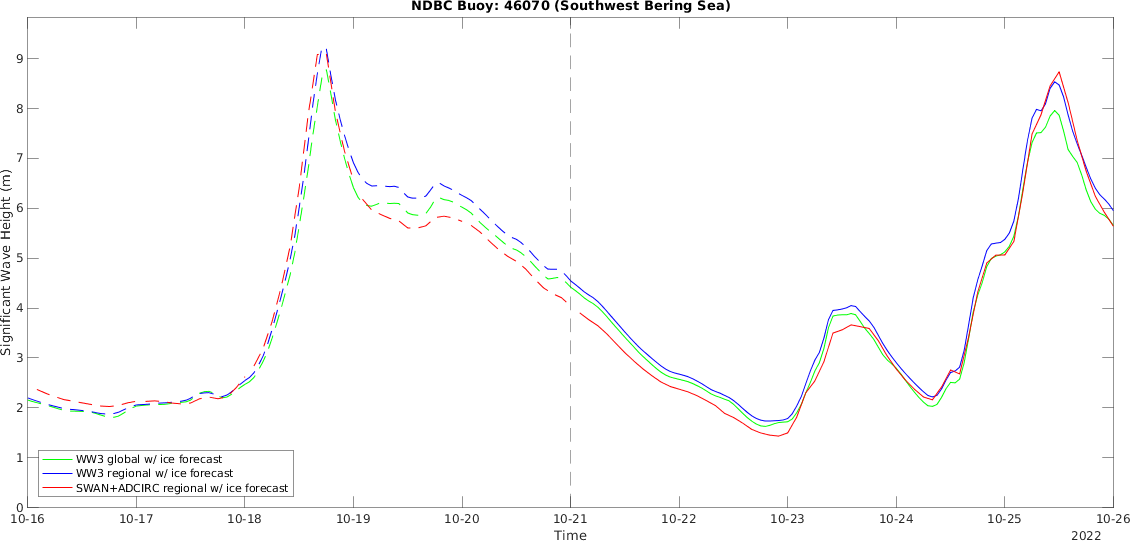
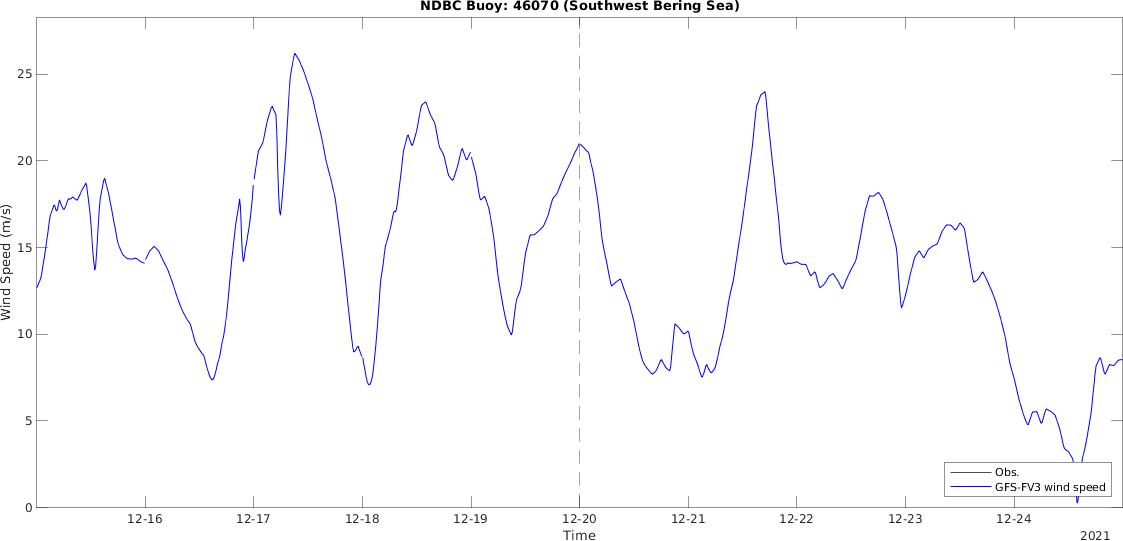
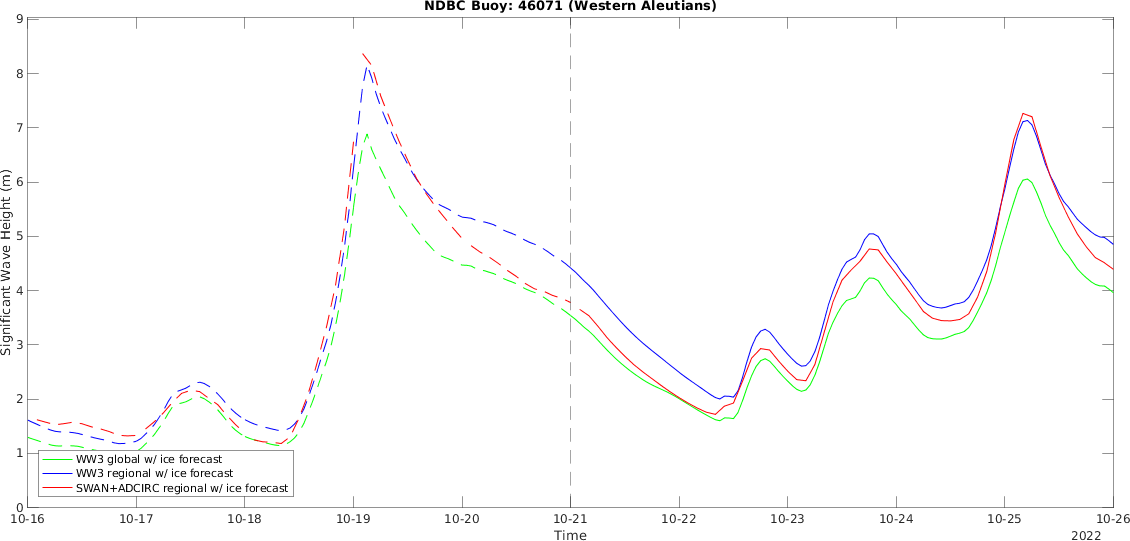
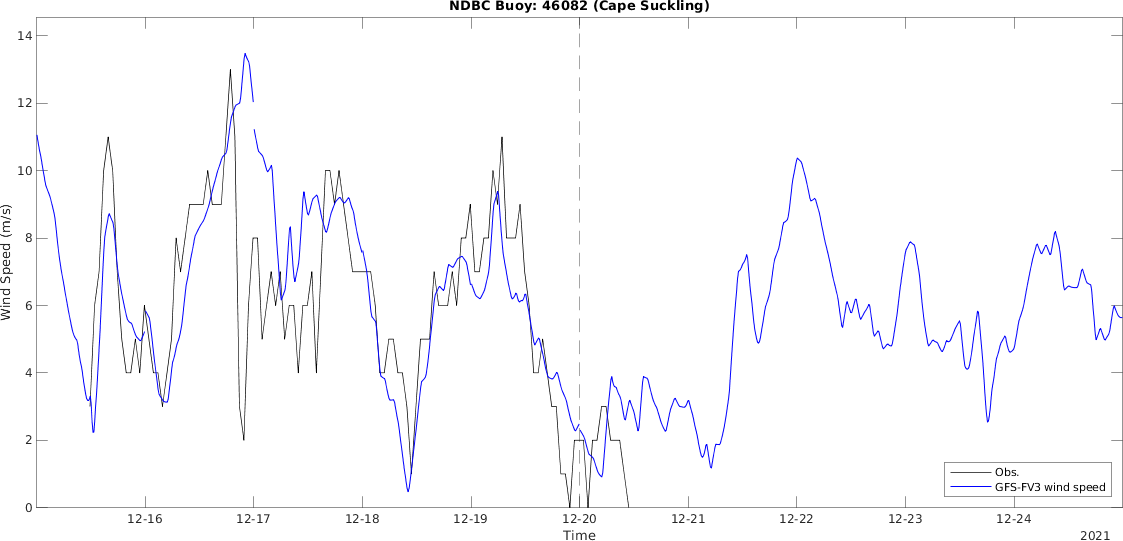
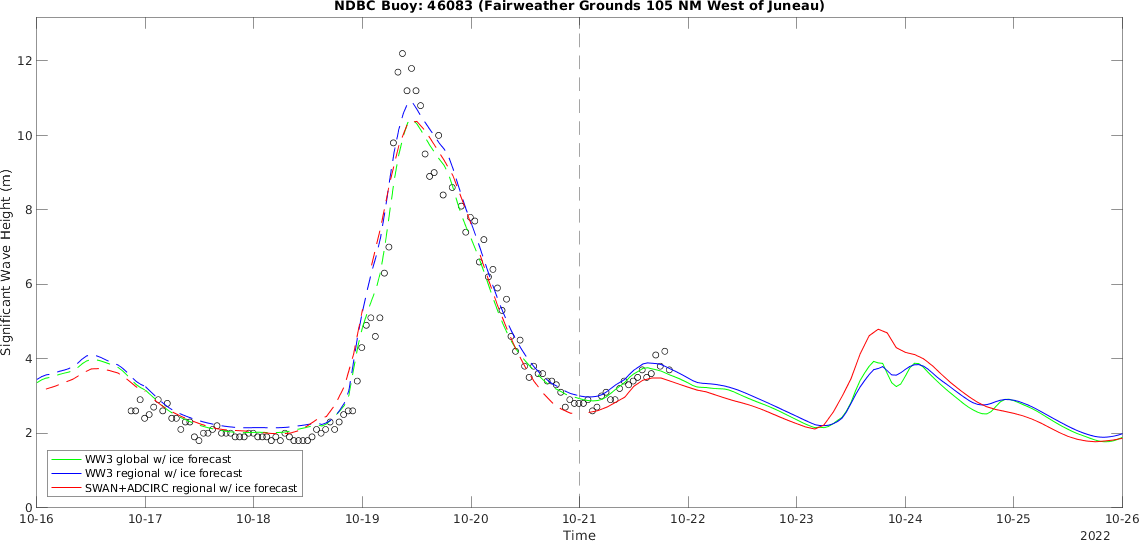
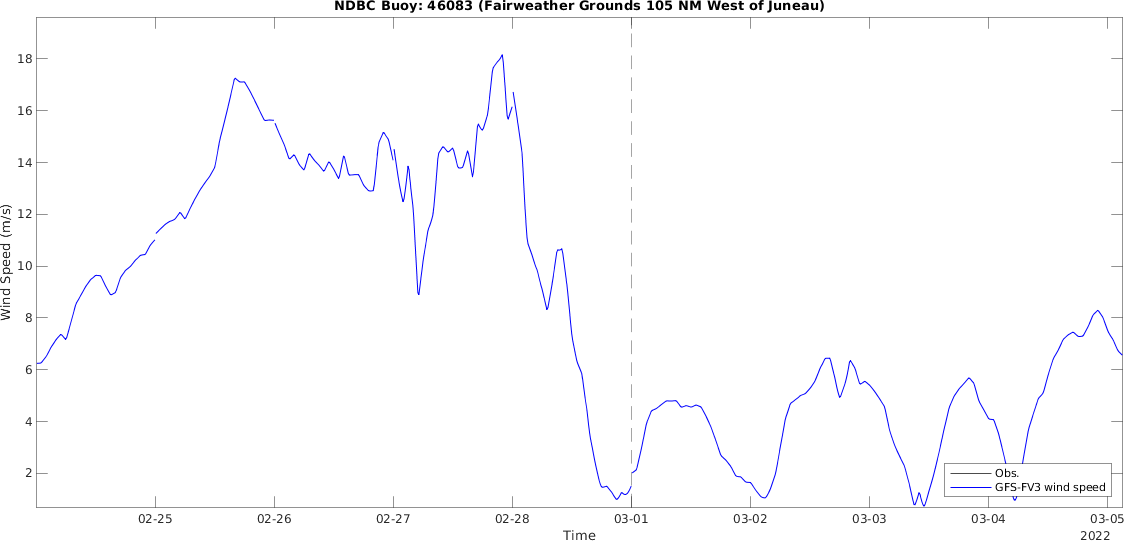
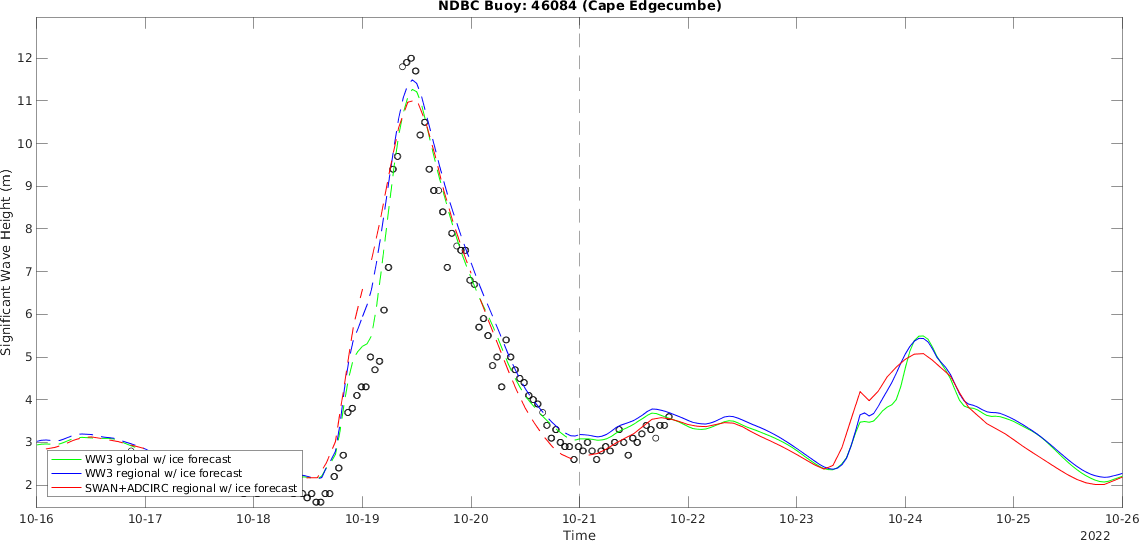
10. Comparison with stations and buoys
NOTES: The water level compared to stations includes 5 day hindcast and 5 day forecast. The positions of stations are showed in the following figure. The red 'x' marks indicate NOAA stations(except the data of St. Michael from JOA Surveys, LLC) are used to compare water level, the green '+' mark indicates the station without observational data, and the blue 'o' marks indicate NDBC buoys are used to compare significant wave height. You can jump to the comparison with each station by clicking on the marker of the following map.
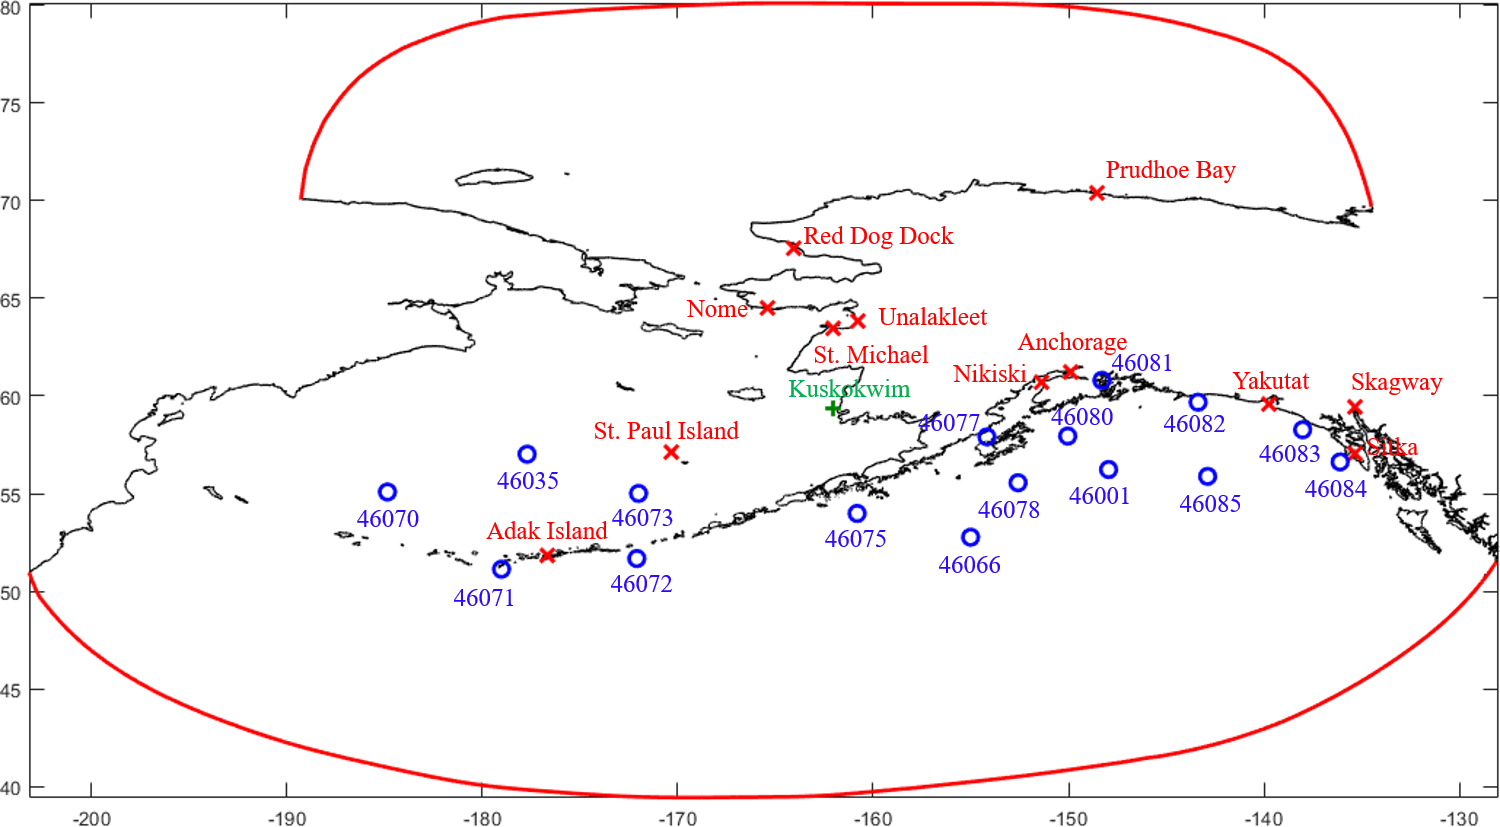 *blue: water level staions with observation; green: water level from model; yellow: wave buoys.
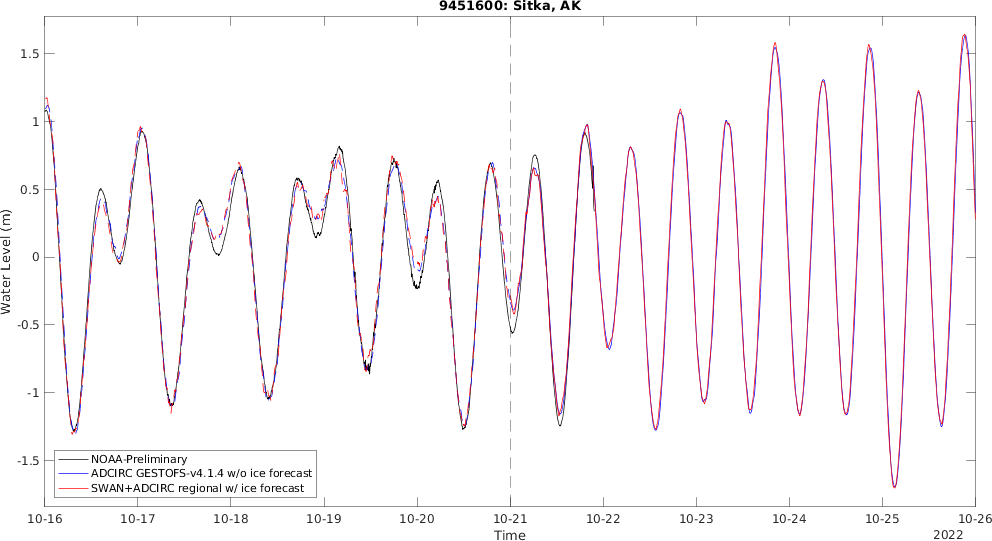
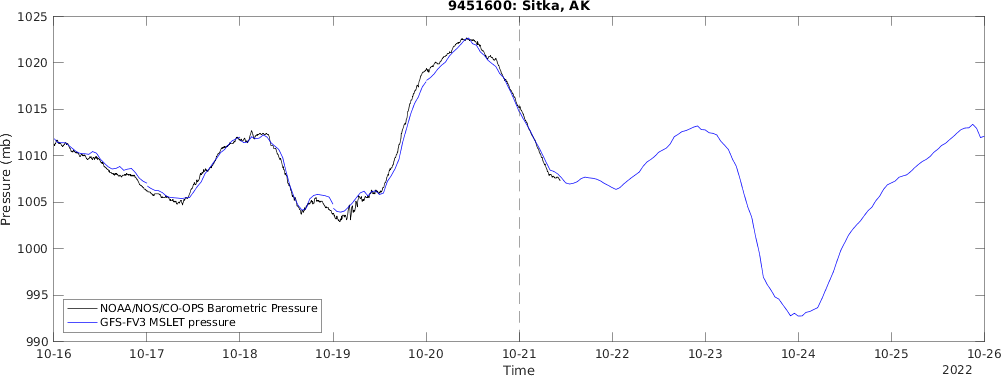
Sitka Station
https://tidesandcurrents.noaa.gov/stationhome.html?id=9451600
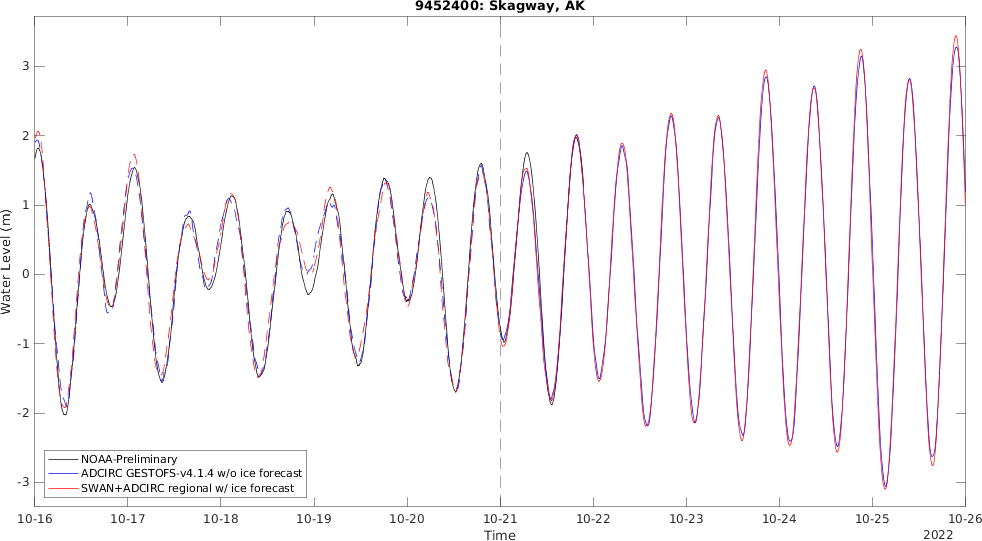
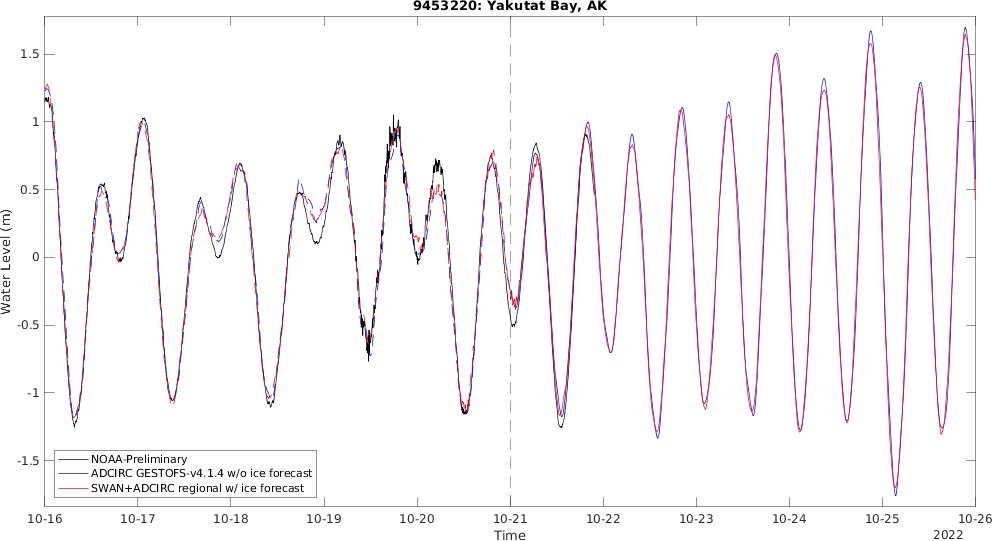
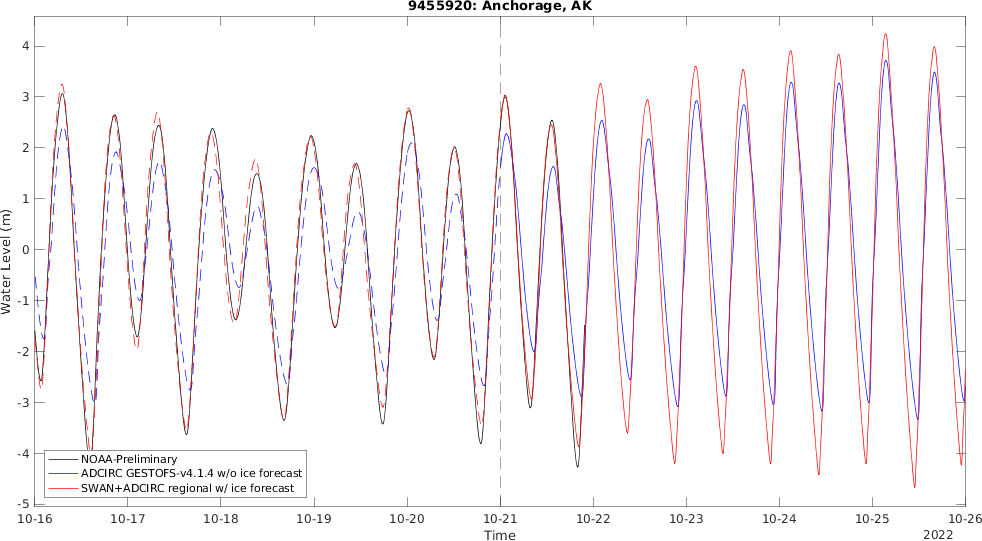
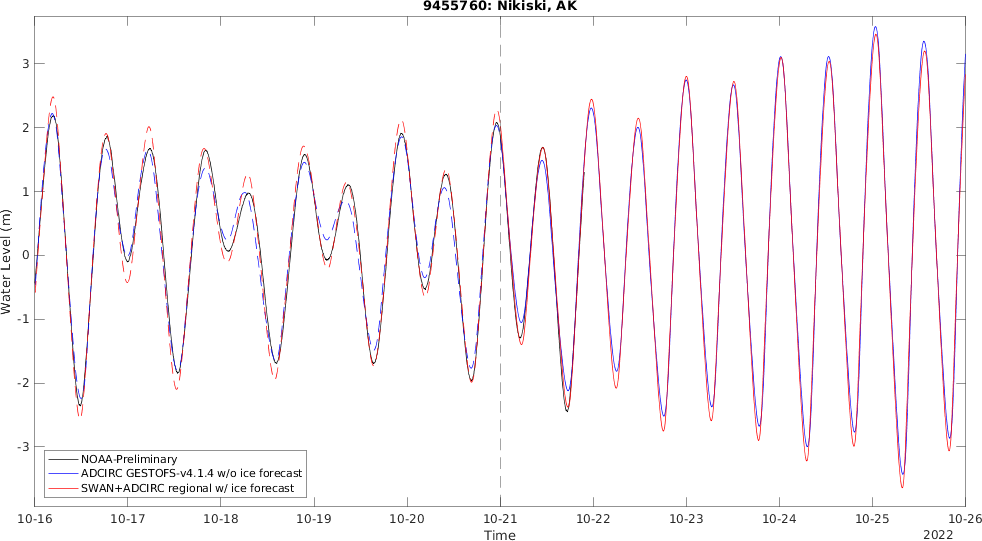
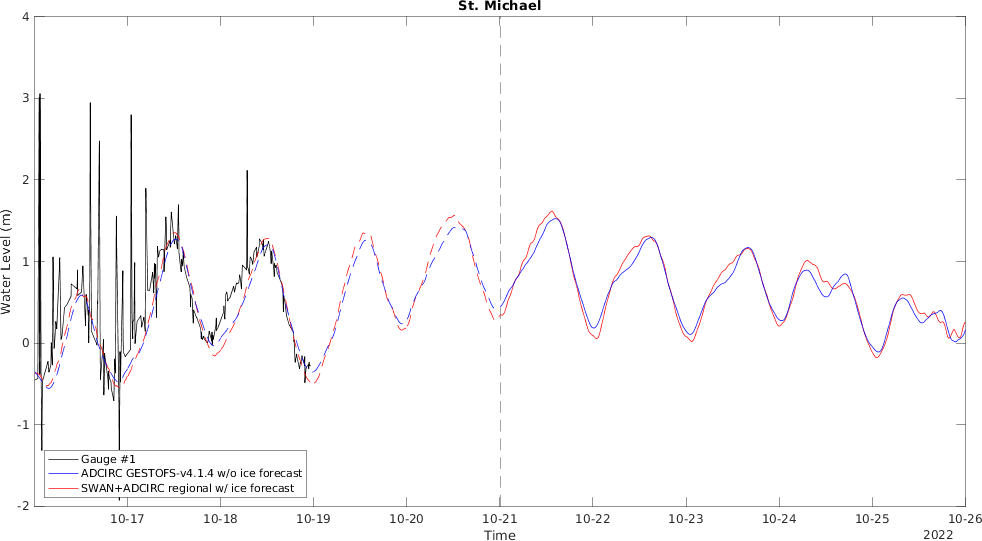
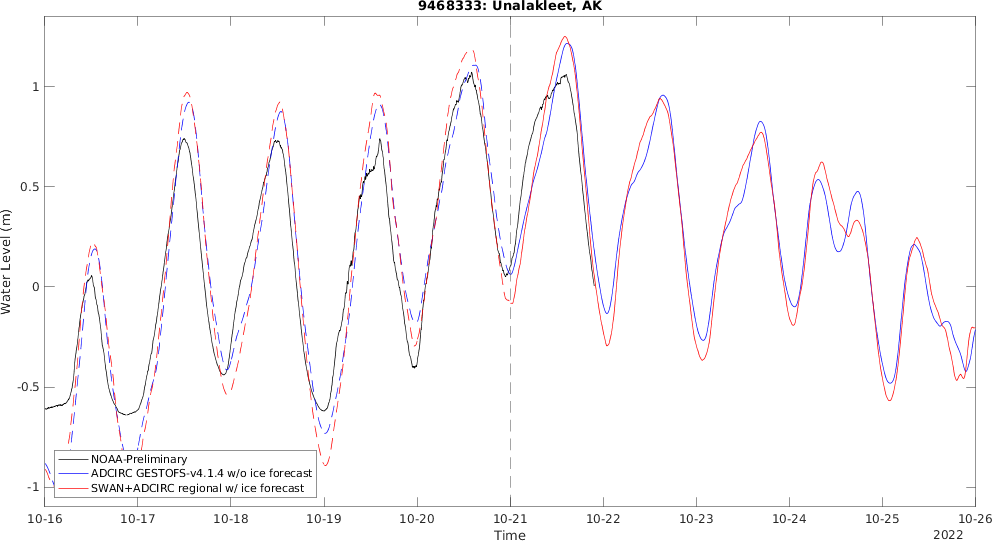
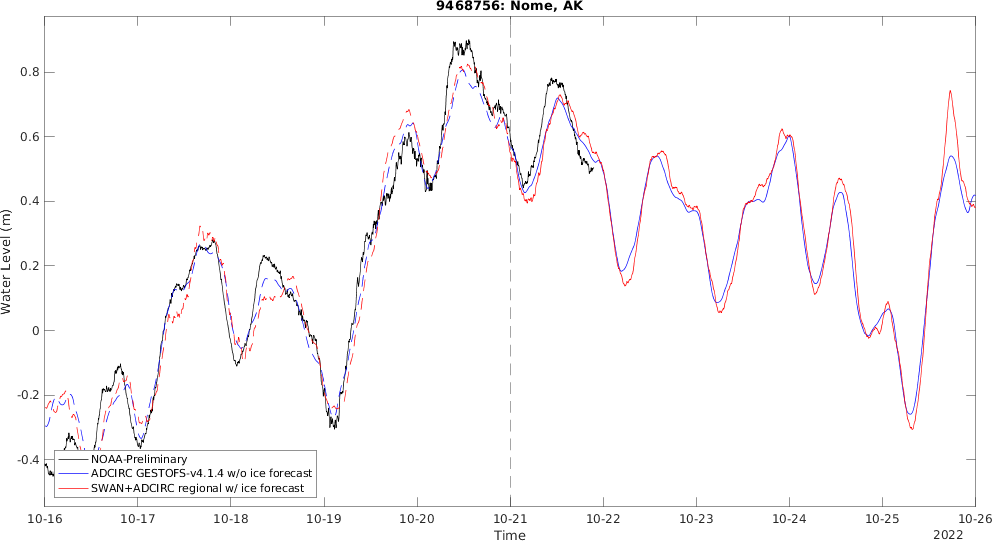
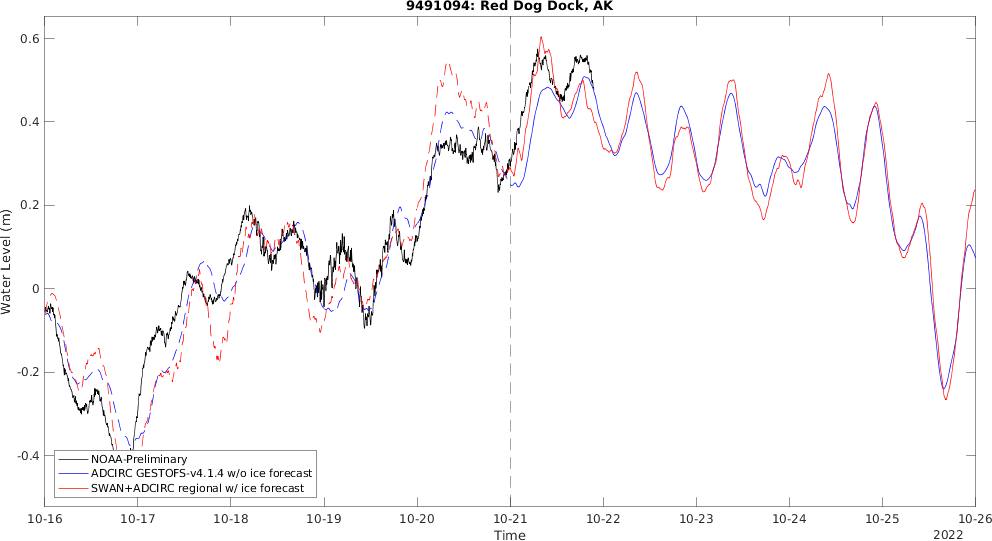
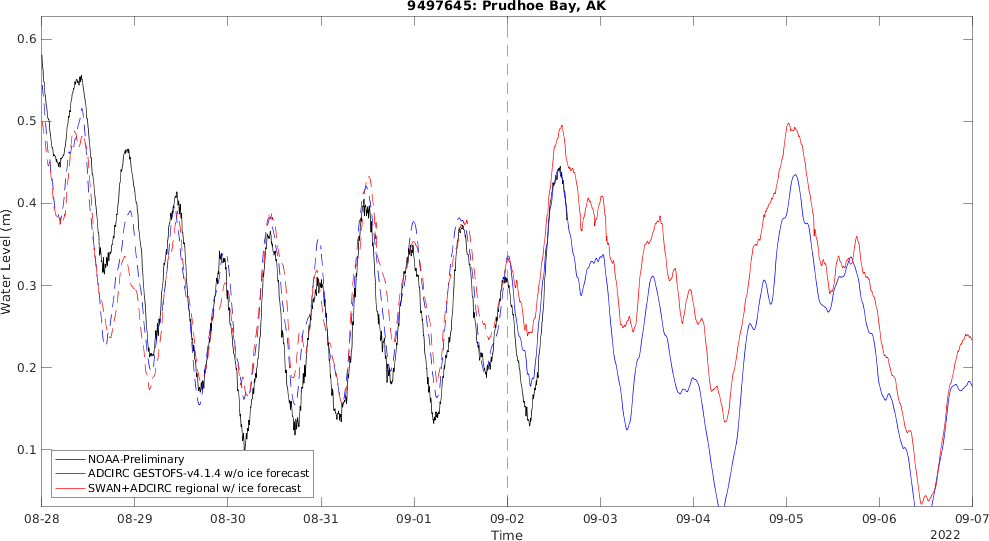
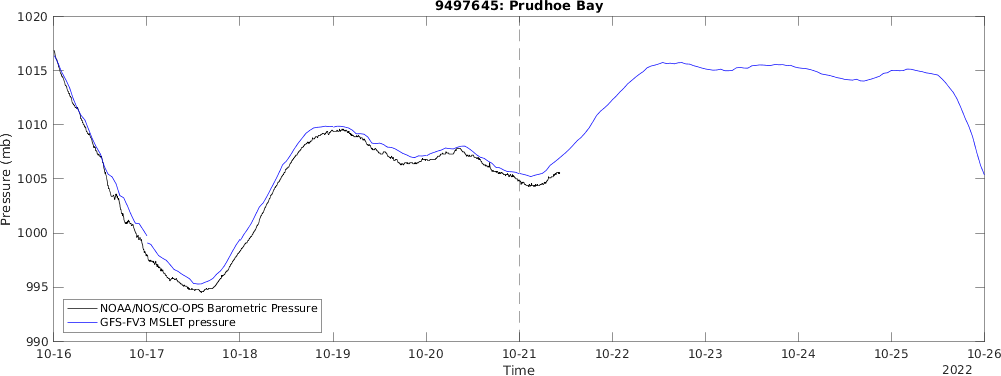
The black line is the observational data, the blue line is the hindcast results, the red line is the forecast results.
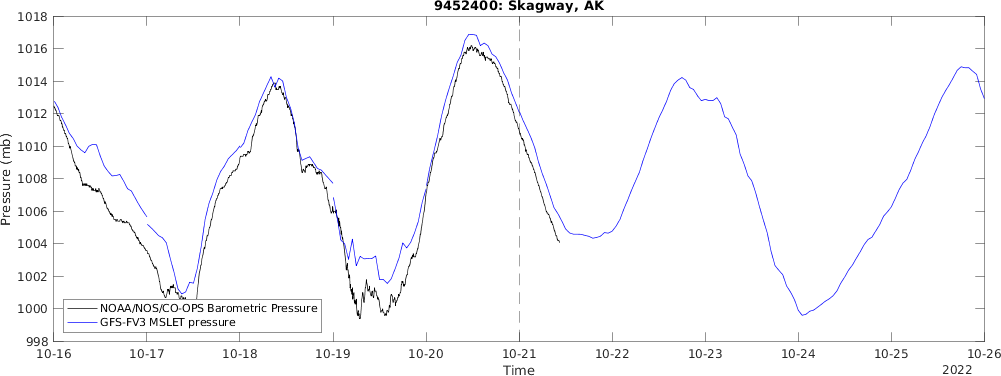
Skagway Station
https://tidesandcurrents.noaa.gov/stationhome.html?id=9452400
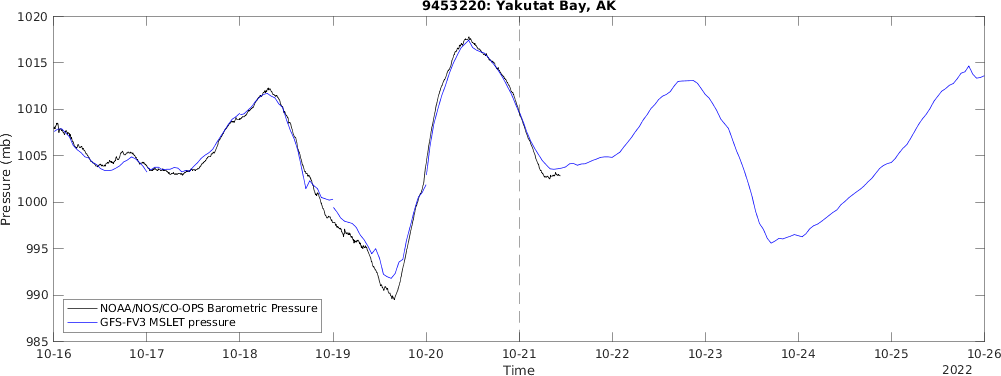
Yakutat Bay Station
https://tidesandcurrents.noaa.gov/stationhome.html?id=9453220
Anchorage Station
https://tidesandcurrents.noaa.gov/stationhome.html?id=9455920

Nikiski Station
https://tidesandcurrents.noaa.gov/stationhome.html?id=9455760
Adak Island Station
https://tidesandcurrents.noaa.gov/stationhome.html?id=9461380
Village Cove, St Paul Island Station
https://tidesandcurrents.noaa.gov/stationhome.html?id=9464212
St. Michael Station
Gauge data is from JOA Surveys, LLC (http://joasurveys.com/rtwl/stmichael/), without filtering.
The real time water levels derived by Global Navigation Satellite System Reflectometry (GNSS-R) based tide gauge (AT01) in St. Michael, refer to https://www.gpsworld.com/a-tidal-shift-monitoring-sea-level-in-the-arctic-using-gnss/.
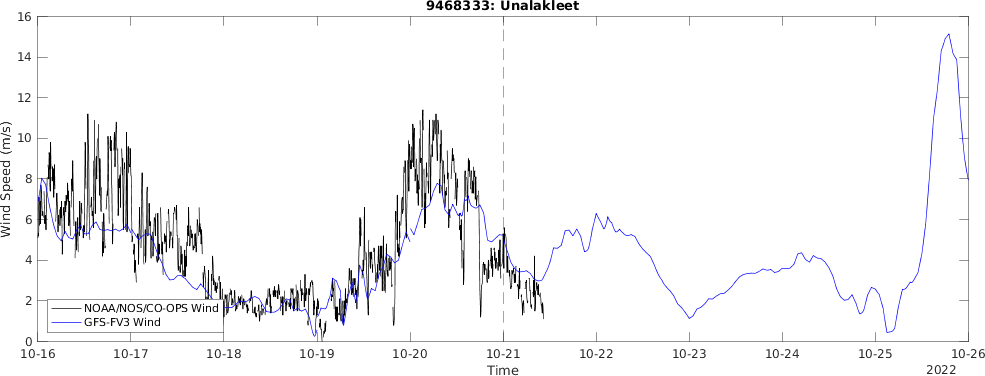
Unalakleet Station
https://tidesandcurrents.noaa.gov/stationhome.html?id=9468333
Note that the Unalakleet station (ID 9468333) is located within an inlet near the mouth of Unalakleet River. The inlet itself is quite narrow (75m). We have noted during both winter and summer months significant unexplained variability in high tides and especially in low tides in the recorded signal, with low tides being limited. We suspect that shoal formation in the vicinity of the inlet and possibly ice formation at the inlet mouth significantly impact the measured tidal signal at the station.
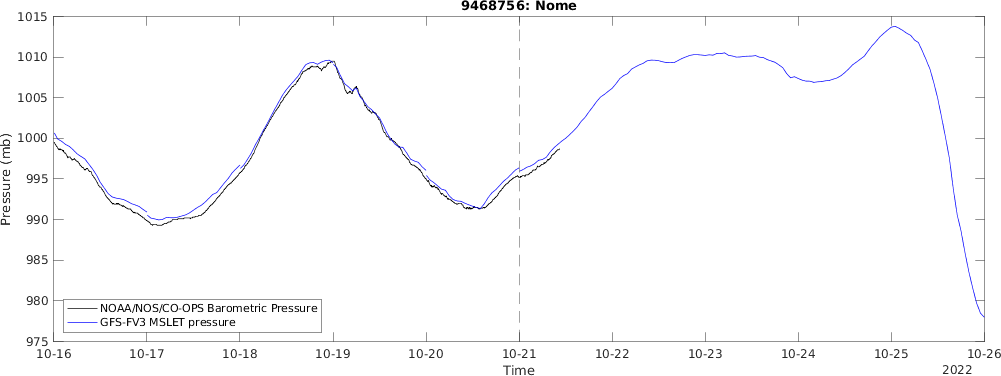
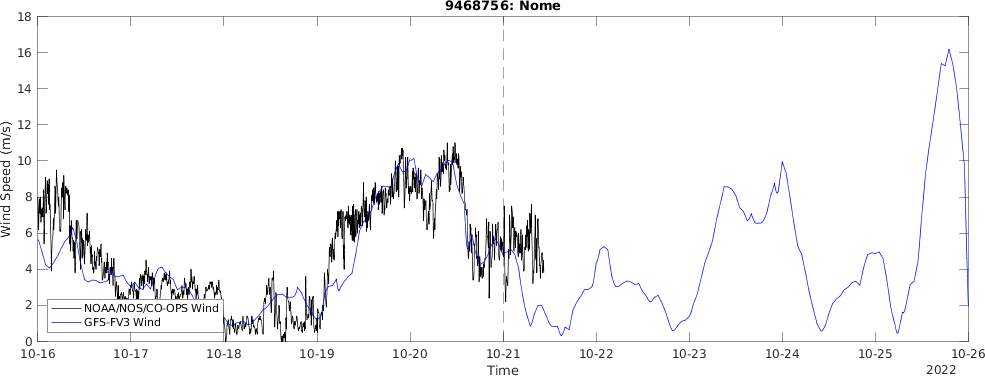
Nome Station
https://tidesandcurrents.noaa.gov/stationhome.html?id=9468756.
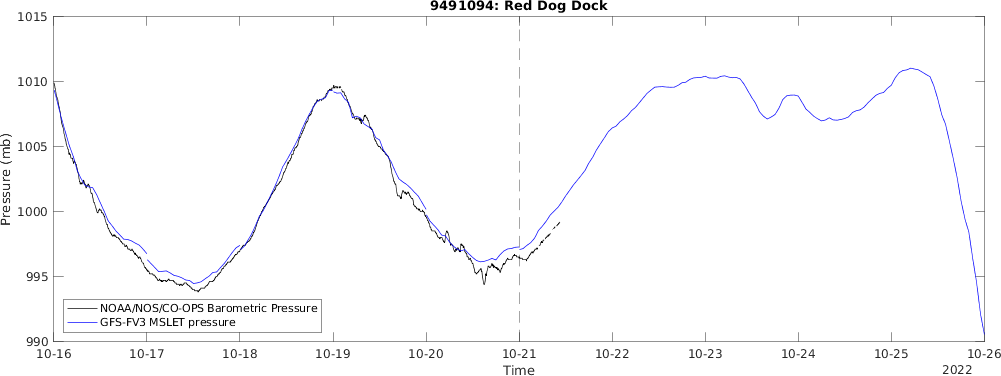
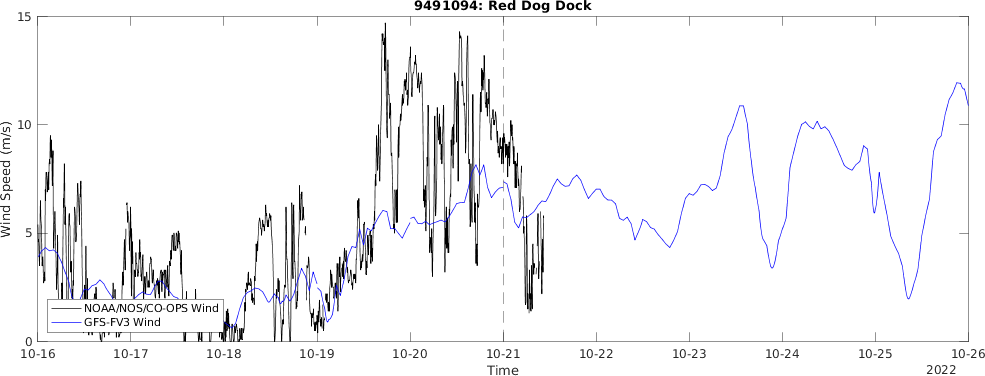
Red Dog Dock Station
https://tidesandcurrents.noaa.gov/stationhome.html?id=9491094
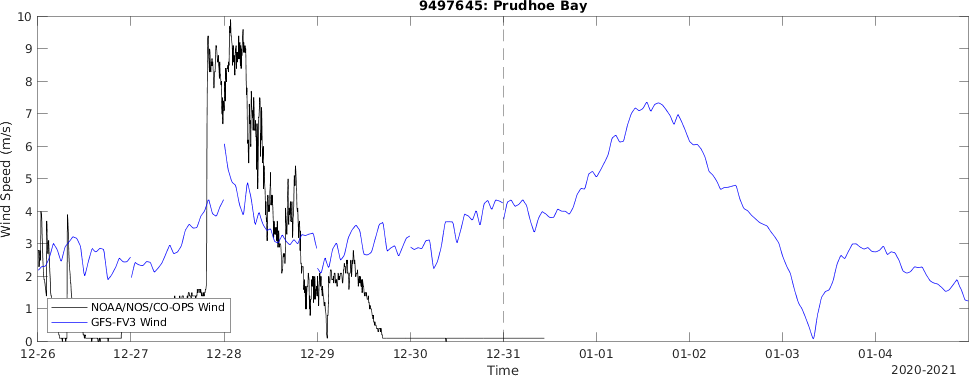
Prudhoe Bay Station
https://tidesandcurrents.noaa.gov/stationhome.html?id=9497645
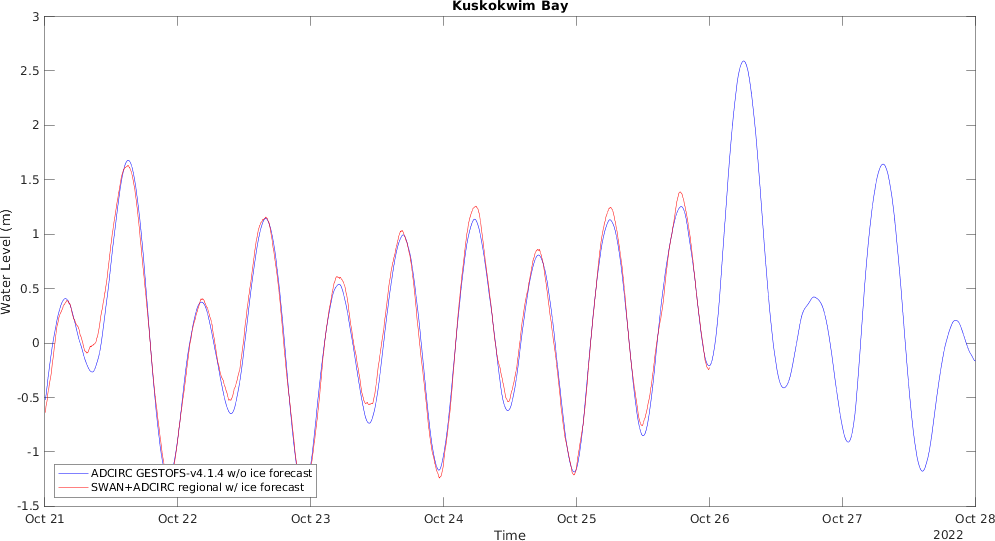
Kuskokwim Bay (5 day forecast)
Location:-162.0293, 59.3780.
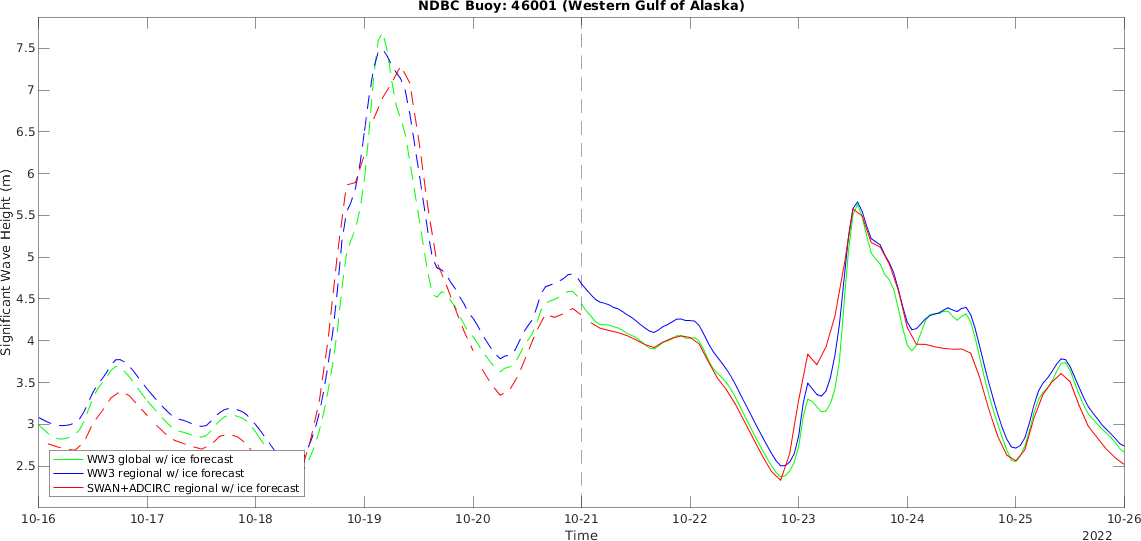
NDBC buoy 46001: Western Gulf of Alaska
https://www.ndbc.noaa.gov/station_page.php?station=46001
NDBC buoy 46035: Central Bering Sea
https://www.ndbc.noaa.gov/station_page.php?station=46035
NDBC buoy 46066: South Kodiak
https://www.ndbc.noaa.gov/station_page.php?station=46066
NDBC buoy 46070: Southwest Bering Sea
https://www.ndbc.noaa.gov/station_page.php?station=46070
NDBC buoy 46071: Western Aleutians
https://www.ndbc.noaa.gov/station_page.php?station=46071
NDBC buoy 46072: Central Aleutians
https://www.ndbc.noaa.gov/station_page.php?station=46072
NDBC buoy 46073: Southeast Bering Sea
https://www.ndbc.noaa.gov/station_page.php?station=46073
NDBC buoy 46075: Shumagin Islands
https://www.ndbc.noaa.gov/station_page.php?station=46075
NDBC buoy 46077: Shelikof Strait
https://www.ndbc.noaa.gov/station_page.php?station=46077
NDBC buoy 46078: Albatross Bank
https://www.ndbc.noaa.gov/station_page.php?station=46078
NDBC buoy 46080: Portlock Bank
https://www.ndbc.noaa.gov/station_page.php?station=46080
NDBC buoy 46081: Western Prince William Sound
https://www.ndbc.noaa.gov/station_page.php?station=46081
NDBC buoy 46082: Cape Suckling
https://www.ndbc.noaa.gov/station_page.php?station=46082
NDBC buoy 46083: Fairweather Grounds 105 NM West of Juneau
https://www.ndbc.noaa.gov/station_page.php?station=46083
NDBC buoy 46084: Cape Edgecumbe
https://www.ndbc.noaa.gov/station_page.php?station=46084
NDBC buoy 46085: Central Gulf of Alaska
https://www.ndbc.noaa.gov/station_page.php?station=46085
11. Overview of the forecasting system
The western coast of Alaska has experienced a number of storm surge events ([1], [2]). In order to predict the water level around the western coast of Alaska, we developed this high resolution and continuously forecasting system. In this system, the ADCIRC [3] storm surge model acts as a main engine and incorporated air-sea-ice drag parameterization, which aim at higher accuracy for predicting water level during winter storm by considering sea ice coverage. For more detail about air-sea-ice drag parameterization, please refer to [5], [6], [7].
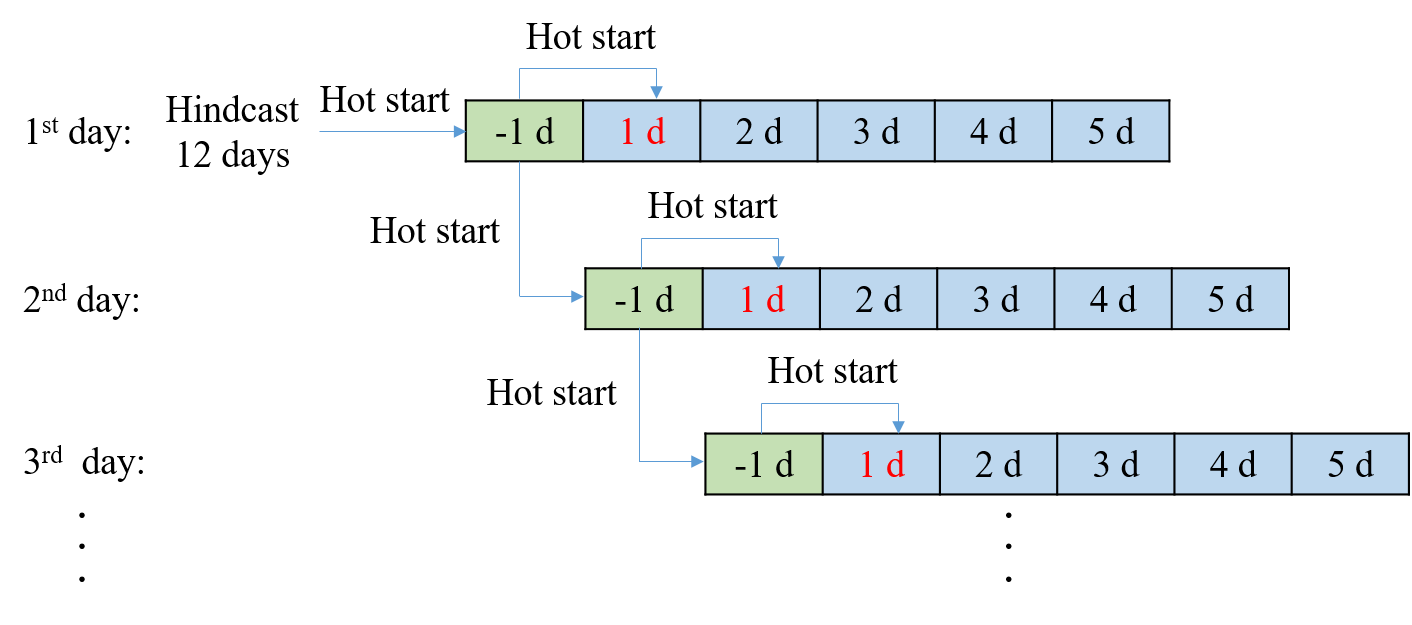
12. Flowchart of the forecasting system
Fig.1 shows the flowchart for this forecasting system. In order to get a high quality initial condition to start the forecast, on the first day of the forecast simulation, we did a 12 days hindcast including 5 days spin up by using GFS reanalysis products (https://www.ncei.noaa.gov/data/global-forecast-system/access/grid-004-0.5-degree/analysis/) for 10 days and GFS forecast products (https://www.ftp.ncep.noaa.gov/data/nccf/com/gfs/prod/) for 2 days, after the 12 days hindcast, the forecast system goes into a daily loop simulation for 6 days including 1 day hindcast(green day in Fig.1) and 5 days forecast(blue days in Fig.1) using GFS forecast products. In Fig.1, the red 1d indicates the present day.
13. Mesh with floodplain (nodes: 1,648,088; elements: 3,211,583)
The mesh showed in Fig.2 is generated by using OceanMesh2D.
Fig.3 shows the mesh resolution, for the parameters of ocean side mesh used in the OceanMesh2D:
min_el=1000, max_el=20000, wl=300, dt=2, grade=0.2, R=2, slp=20, dis=0.35, max_el_ns=1000,
and several specify bounding boxes for bays and inlets (Cook Inlet, Bristol Bay, Aleutian Islands, Kotzebue Sound, St. Lawrence Island) are set for min_el=200.
For the floodplain side, there are two floodplains in the mesh,
the first one is located at the north of Alaska, the second one is at Yukon Delta:
for the first one min_el=200, the second one min_el=100 and the other parameters are set the same as ocean side.
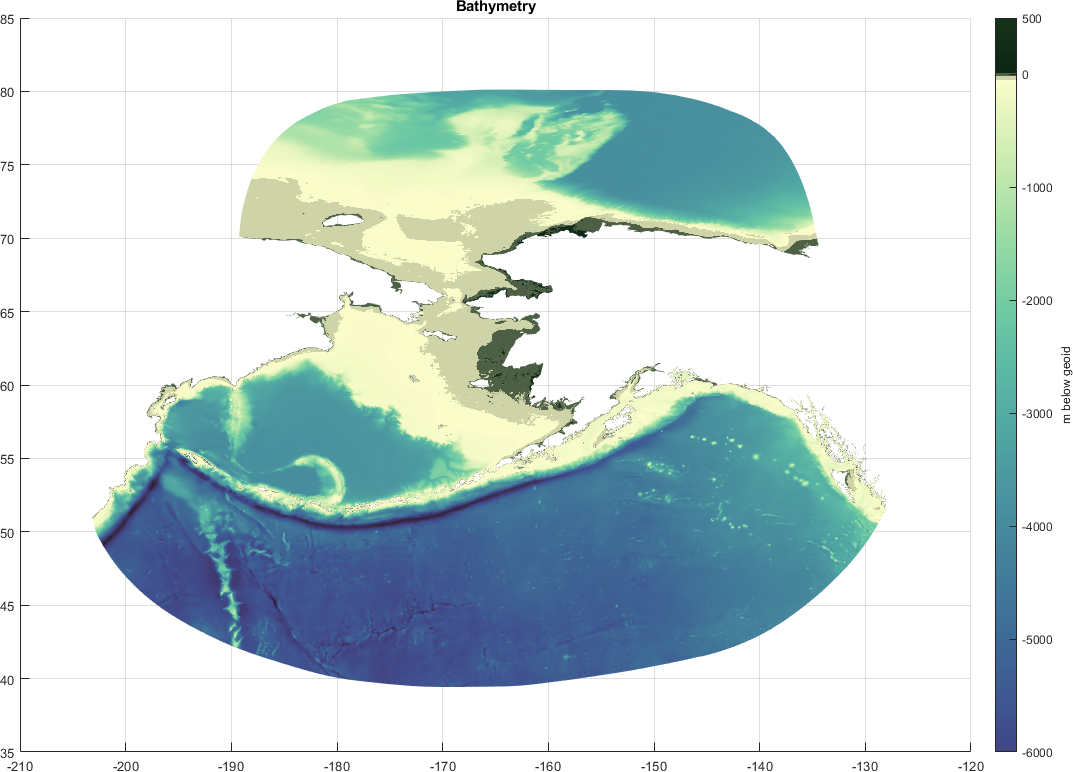
For the bathymetry data, we blended the GEBCO2020, the Smooth Sheet bathymetry of Aleutian Islands, Cook Inlet, Central Gulf of Alaska, Norton Sound, and the Southern Alaska Coastal Relief Model(CRM) bathymetry around Lynn Canal area. In the Fig.4, the dark green areas above 0 meter are flood plains.


14. Forcing boundary conditions and simulation conditions
8 tidal harmonic constituents are forcing on the open ocean boundaries,
4 semi-diurnal: M2, N2, S2, K2;
4 diurnal: K1, Q1, O1, P1.
The simulation is based on air-sea-ice drag parameterization incorporated ADCIRC ver. 55, the following are some settings for the parameters in ADCIRC.
ICS=-22, IM=511112, NTIP=2, TAU0=-3, DTDP=2, NTIF=8, NWS=14 (w/o ice), NWS=14014 (w/ ice), NWS=14314 (w/ ice&SWAN)...
15. References
- W. Blier, S. Keefe, W.A. Shaffer and S.C. Kim: Storm Surges in the Region of Western Alaska, Monthly Weather Review, Vol.125, 1997.
- R.S. Chapman, S.C. Kim and D.J. Mark: Storm-Induced Water Level Prediction Study for the Western Coast of Alaska, ERDC/CHL Letter Report, 2009.
- ADCIRC: https://adcirc.org/.
- SWAN+ADCIRC: https://ccht.ccee.ncsu.edu/swanadcirc/.
- Brian R. Joyce, William J. Pringle, Damrongsak Wirasaet, Joannes J. Westerink, Andre J. Van der Westhuysen, Robert Grumbine, Jesse Feyenc: High resolution modeling of western Alaskan tides and storm surge under varying sea ice conditions, Ocean Modelling, Vol.141, 101421, 2019.
- Christof Lüpkes, Vladimir M. Gryanik, Jörg Hartmann, and Edgar L Andreas: A parametrization, based on sea ice morphology, of the neutral atmospheric drag coefficients for weather prediction and climate models, Journal of Geophysical Research, Vol.117, D13112, 2012.
- G. Ling, D. Wirasaet, J. Westerink, D. H. Richter, B. Joyce, W. Pringle, M. T. Contreras Vargas, K. R. Steffen, C. N. Dawson, A. Fujisaki-Manome, E. Myers, S. Moghimi, S. V. Vinogradov, A. Van der Westhuysen, A. Abdolali, and R. Grumbine: Studies on Parameterizations of Sea Ice Effect in a Storm Surge Model for Western Alaska,
https://ams.confex.com/ams/2020Annual/webprogram/Paper370912.html, AMS, 2020.
- C.O. Collins and W.E. Rogers, A Source Term for Wave Attenuation by Sea ice in WAVEWATCH III ®: IC4, NRL Report NRL/MR/7320--17-9726, 2017.
- M.H. Meylan, L.G. Bennette and A.L. Kohout: In situ measurements and analysis of ocean waves in the Antarcticmarginal ice zone, Geophysical Research Letters, Vol.41(14), pp. 5046–5051, 2014.
- GLOCOFFS (GLObal Coastal Ocean Flood Forecasting System): https://wpringle.github.io/GLOCOFFS/.